
This project showcases a B2B, SaaS case study with a focus on data visualization. I took the lead in designing the Insight feature, ensuring seamless integration into an established fleet management web application.
My Role
As the sole designer, I lead the design project for a small team, collaborating directly with the CEO, business development, and a developer.
The background
In 2020, the fleet driver turnover rate hit 80%, amid a shortage of 60,000 drivers, underscoring the pressing need to aid fleet managers.
Safemode addresses fleet challenges by providing a web app for managers and a mobile app for drivers. It offers personalized rewards to enhance driver behavior and retention amidst a driver shortage.
4 weeks,
add a completely new feature to the existing web app
Problem Space
While the Safemode web app provides fleet managers with comprehensive data on drivers' behavior, there remains a lack of scalable tools to effectively glean insights from this data and assist drivers in cultivating better habits. Despite the wealth of data available, fleet managers currently face challenges in accurately identifying successful drivers and pinpointing areas where improvement is needed.
Target Users
Fleet Managers tasked with optimizing operational efficiency and ensuring driver safety and compliance.
How Might We
HMW provide actionable insights derived from comprehensive data analysis?
HMW offer clear recommendations to optimize driver behavior and workforce allocation?
HMW boost operational efficiency effectively?
Business Objectives
Increase sales of the web application.
Expand customer base in fleet management.
Improve customer retention and satisfaction.
Generate revenue growth through subscriptions.
Establish the application as the preferred solution.
Key Metrics
Conversion rate
User engagement metrics
Feature adoption rate
Customer retention rate
Customer satisfaction rate
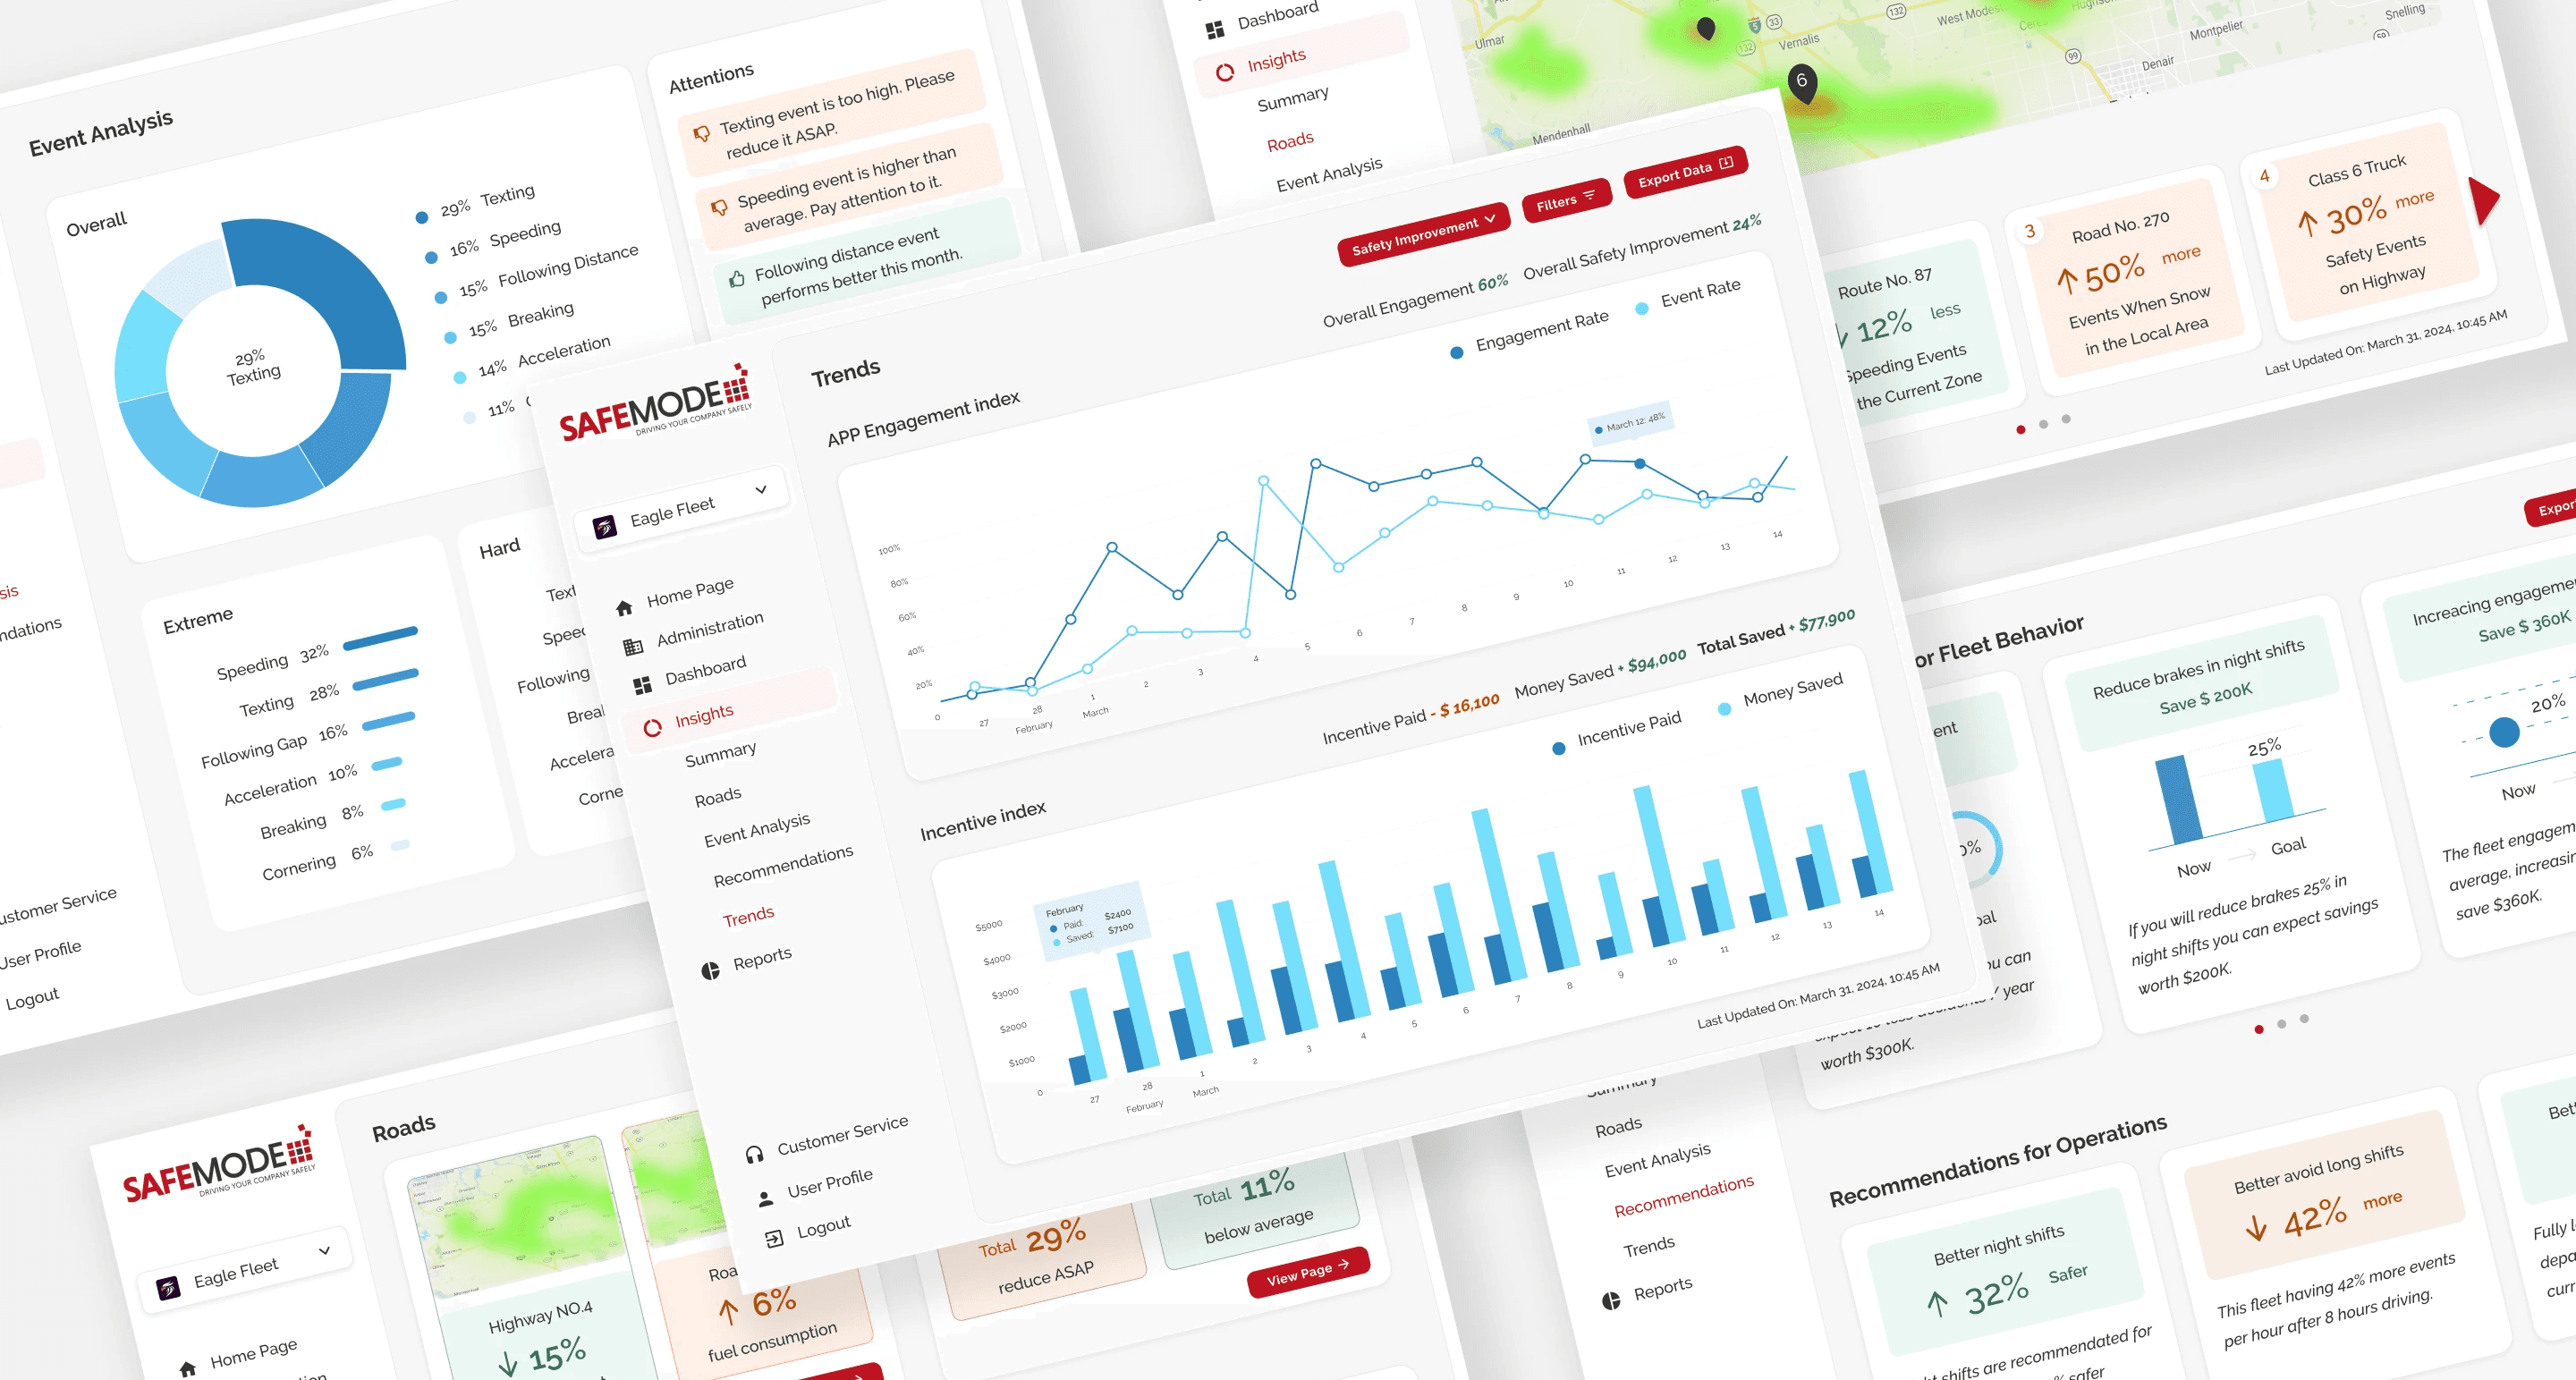
Quick Preview of the Final Design
Add an insight feature to analyze drivers' behavior and road condition data, offering actionable recommendations to aid fleet managers in optimizing operations.
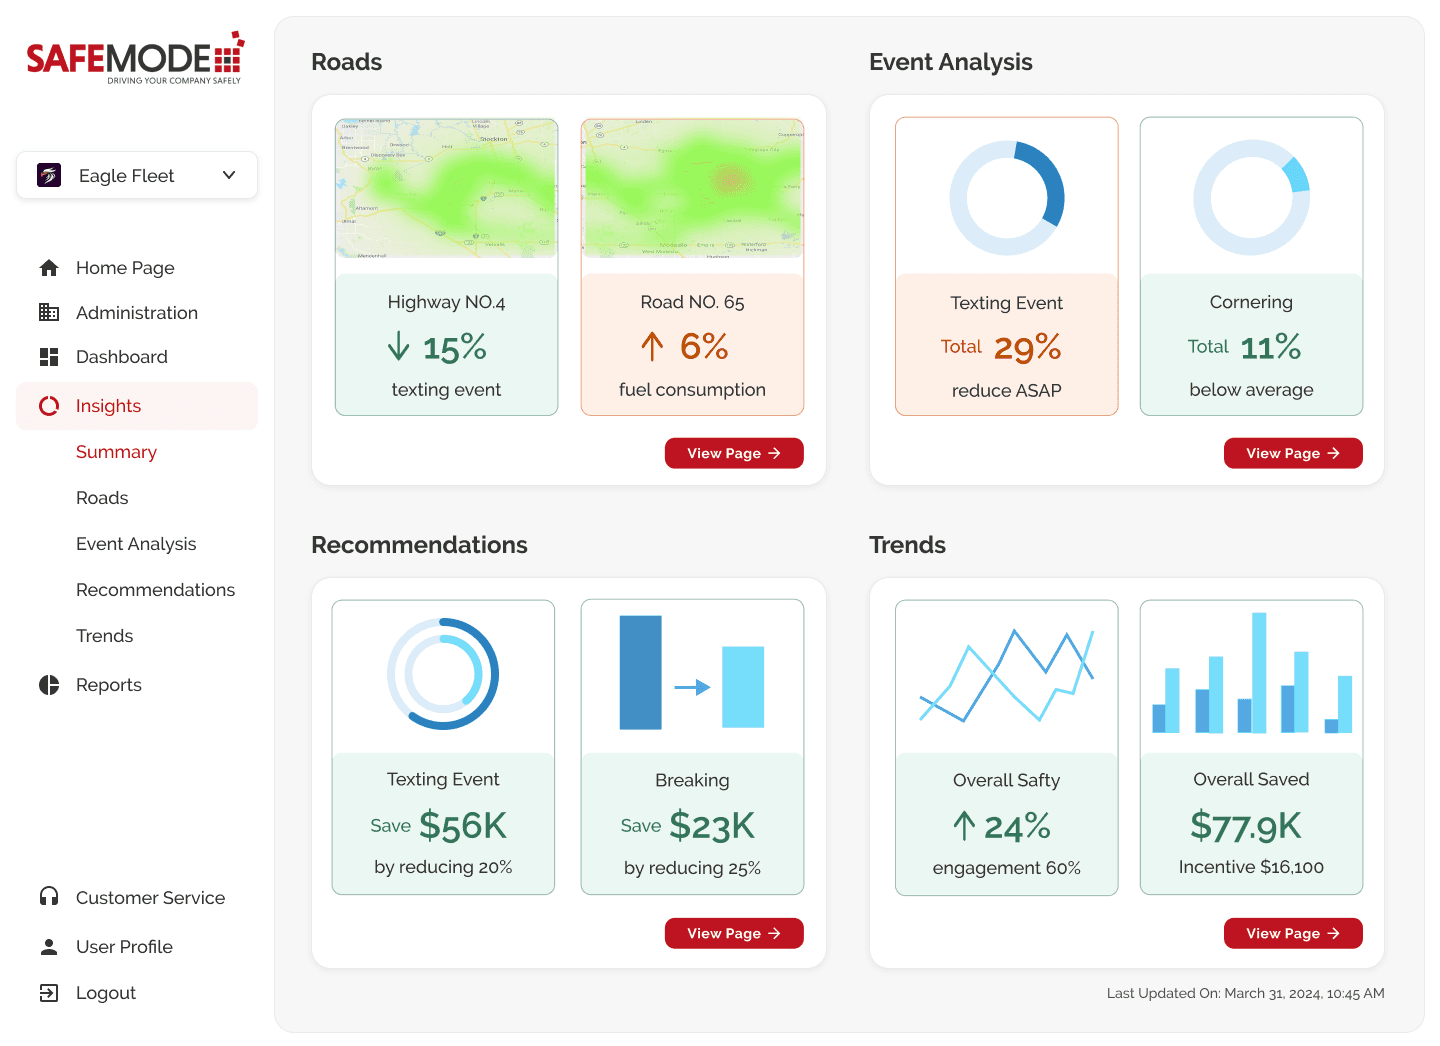
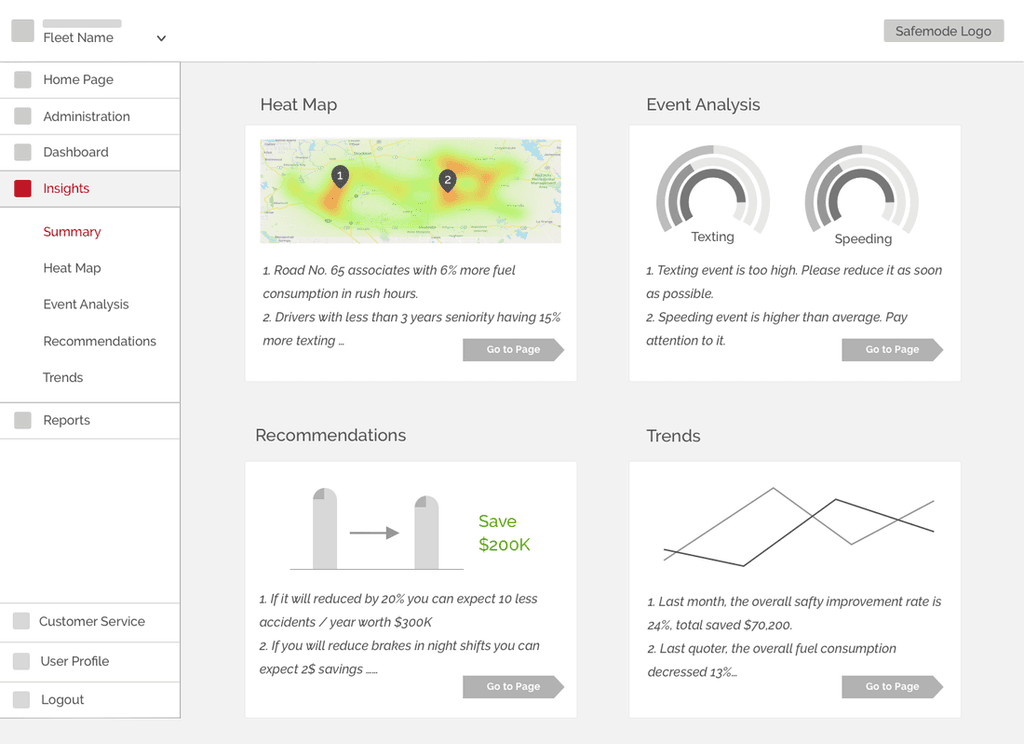
Data Insights Summary Page
Provides a quick snapshot of key data insights for efficient decision-making.
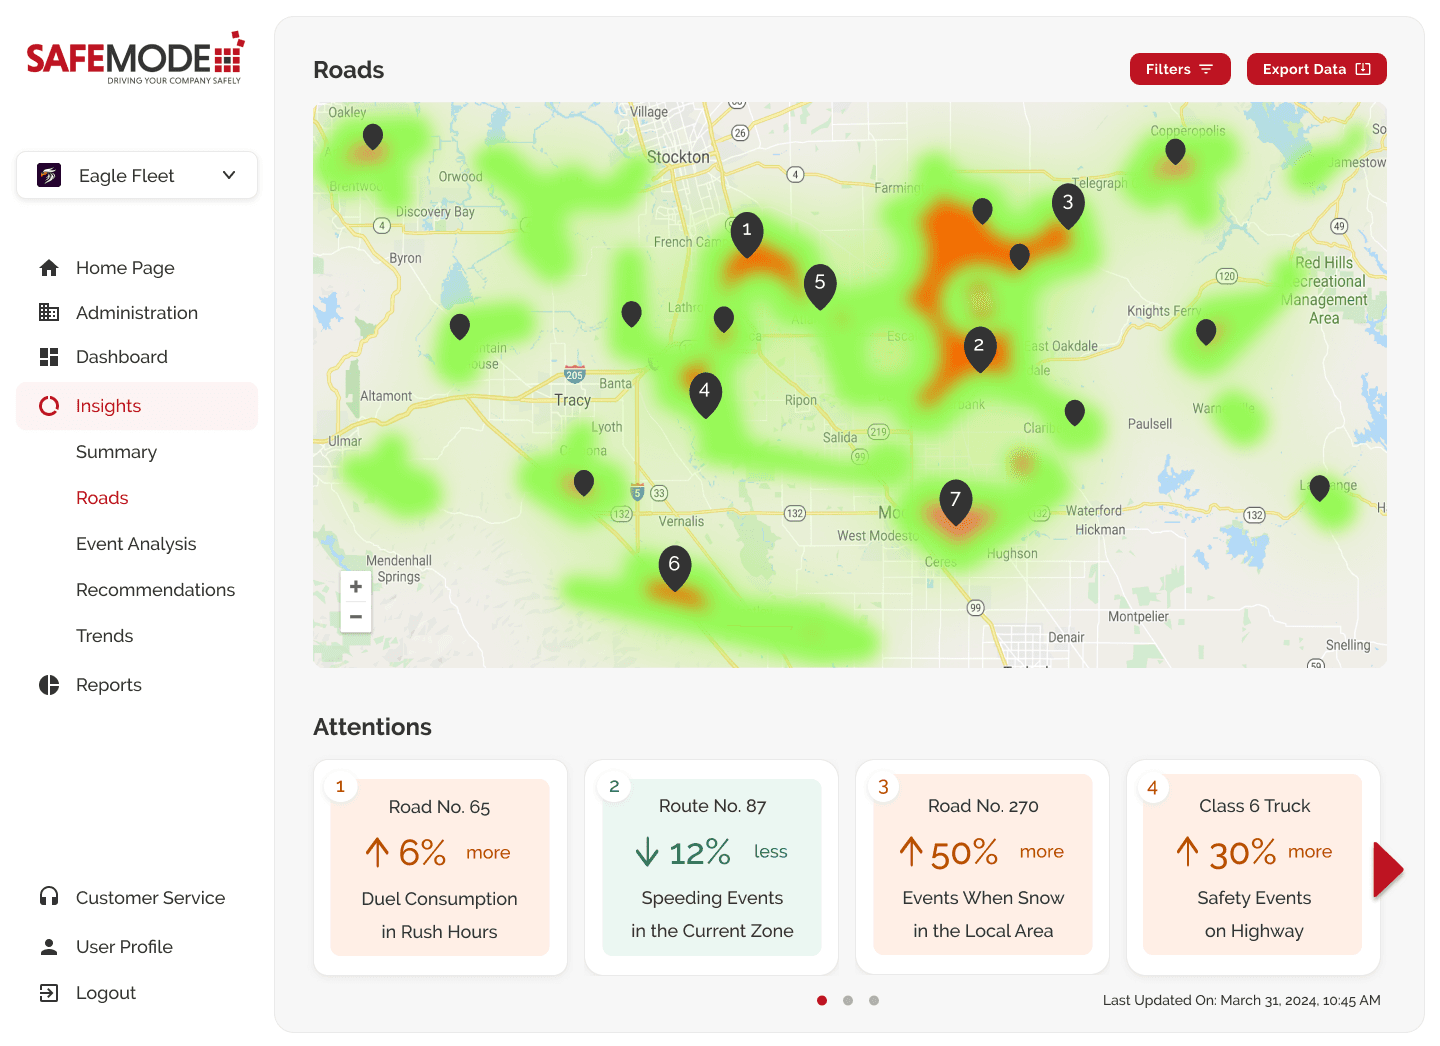
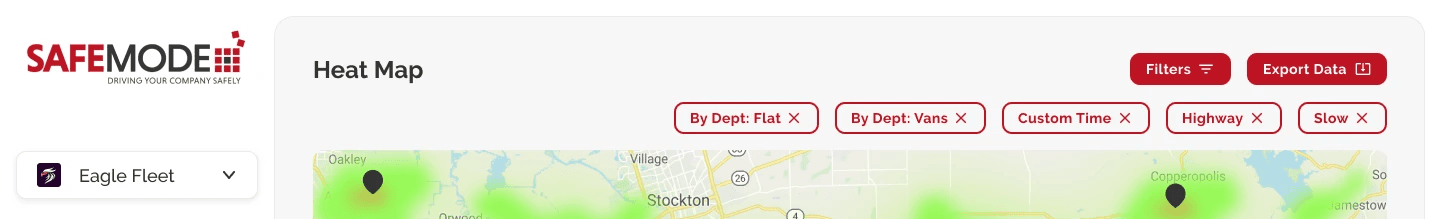
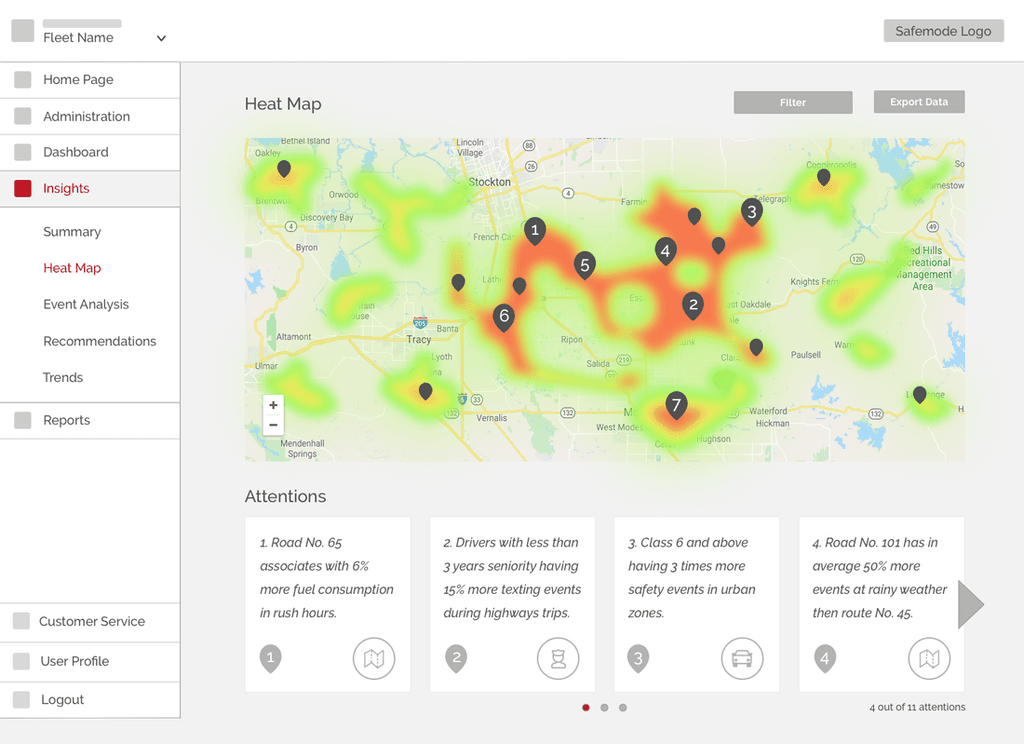
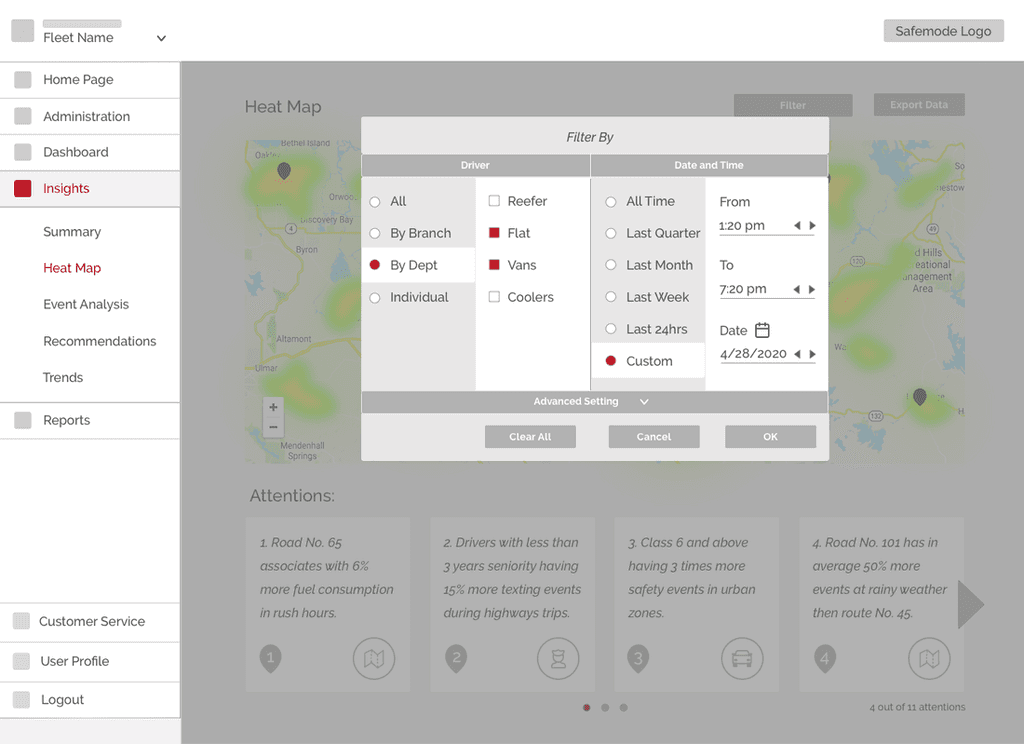
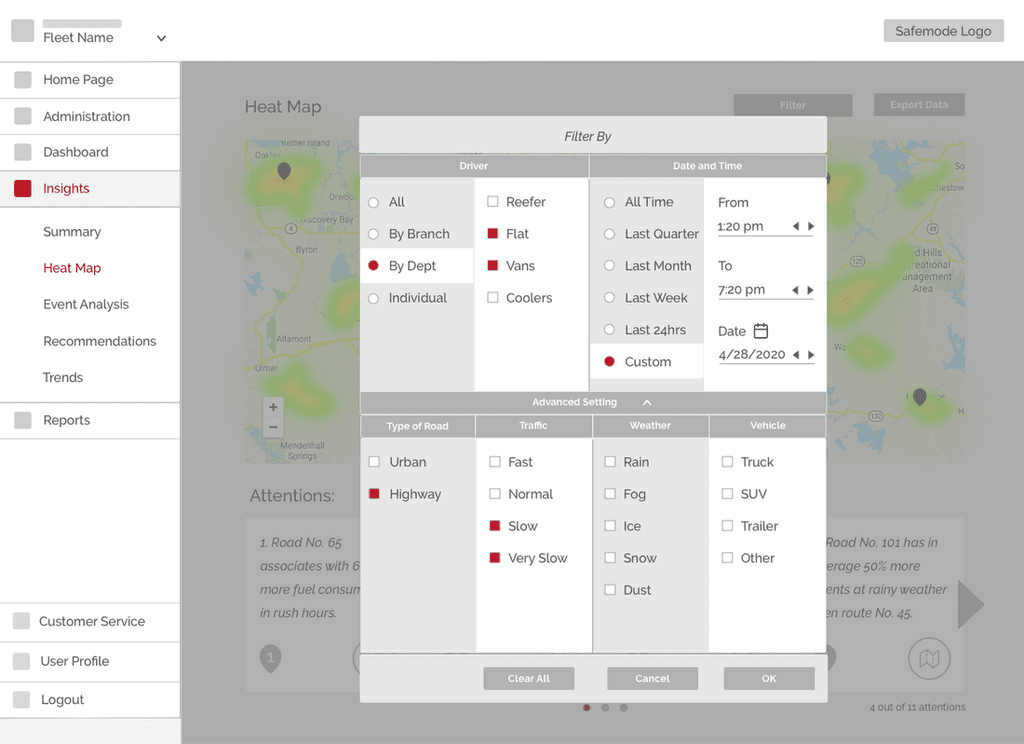
Roads Page
Offers fleet managers insights for planning based on current road conditions and predictions.
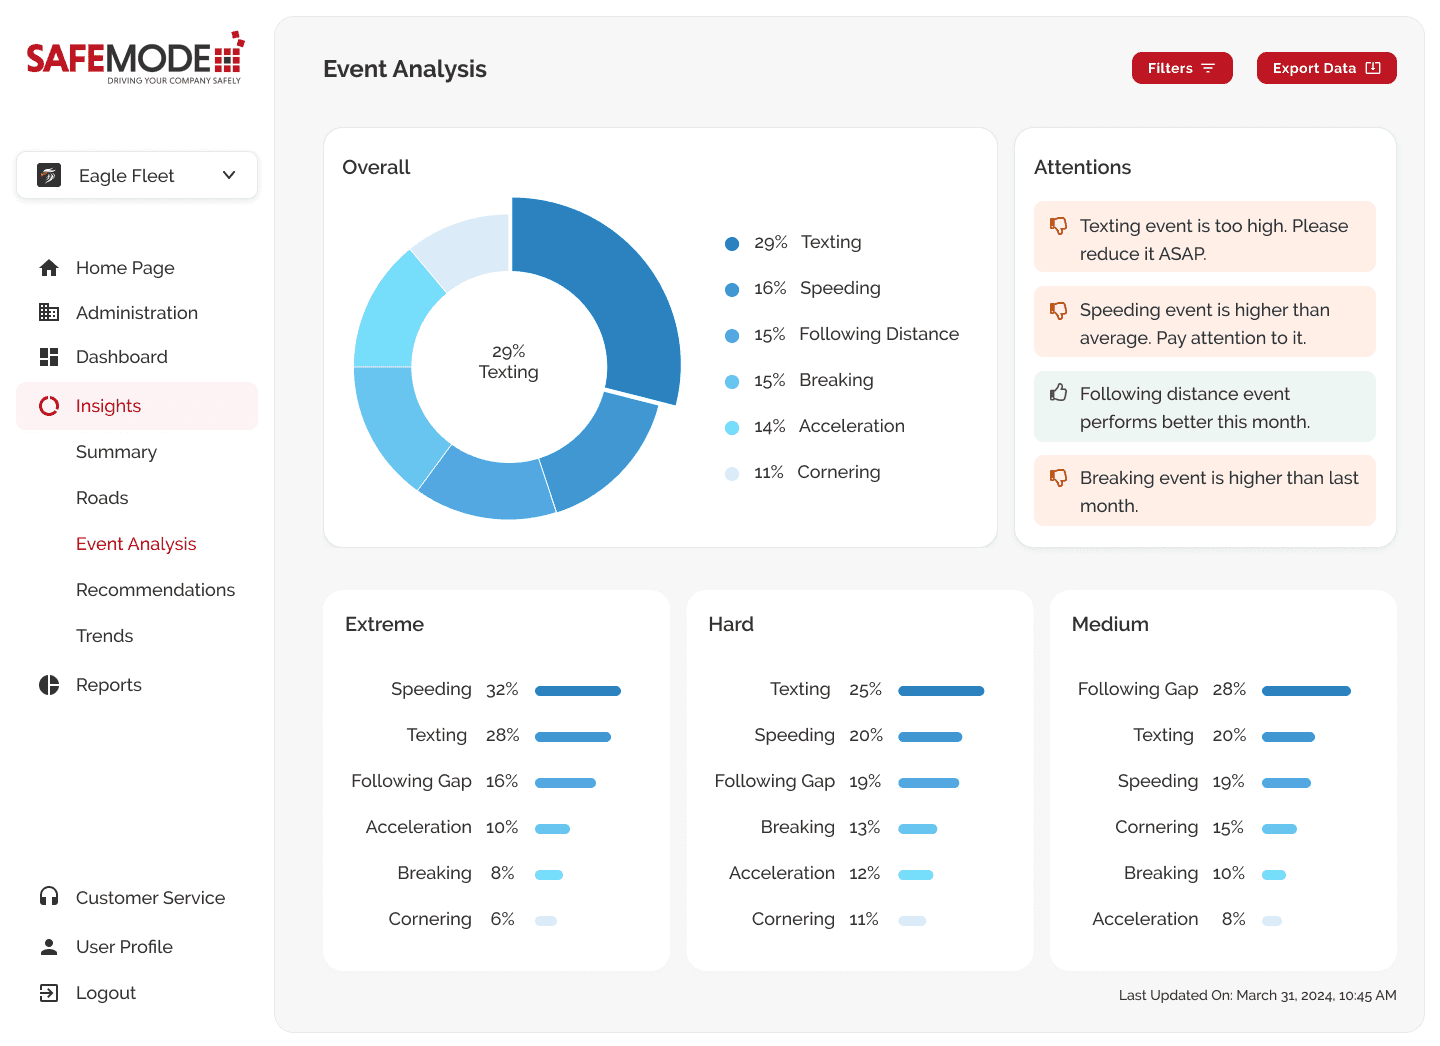
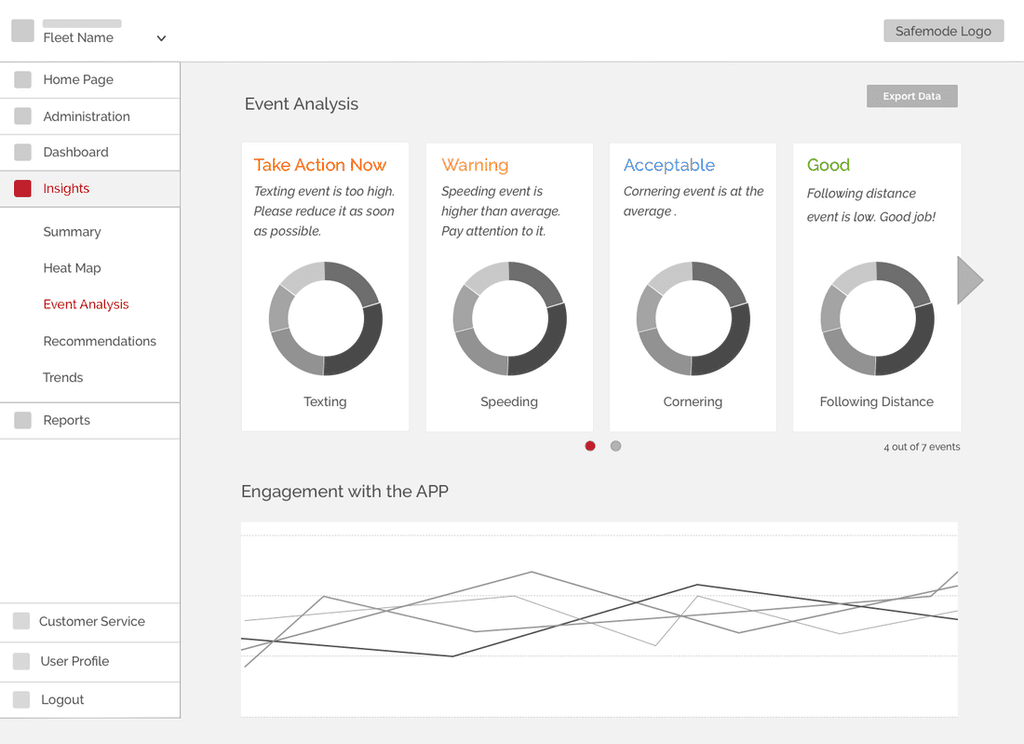
Event Analysis Page
Provides analysis on critical events and alerts users to potential safety issues.
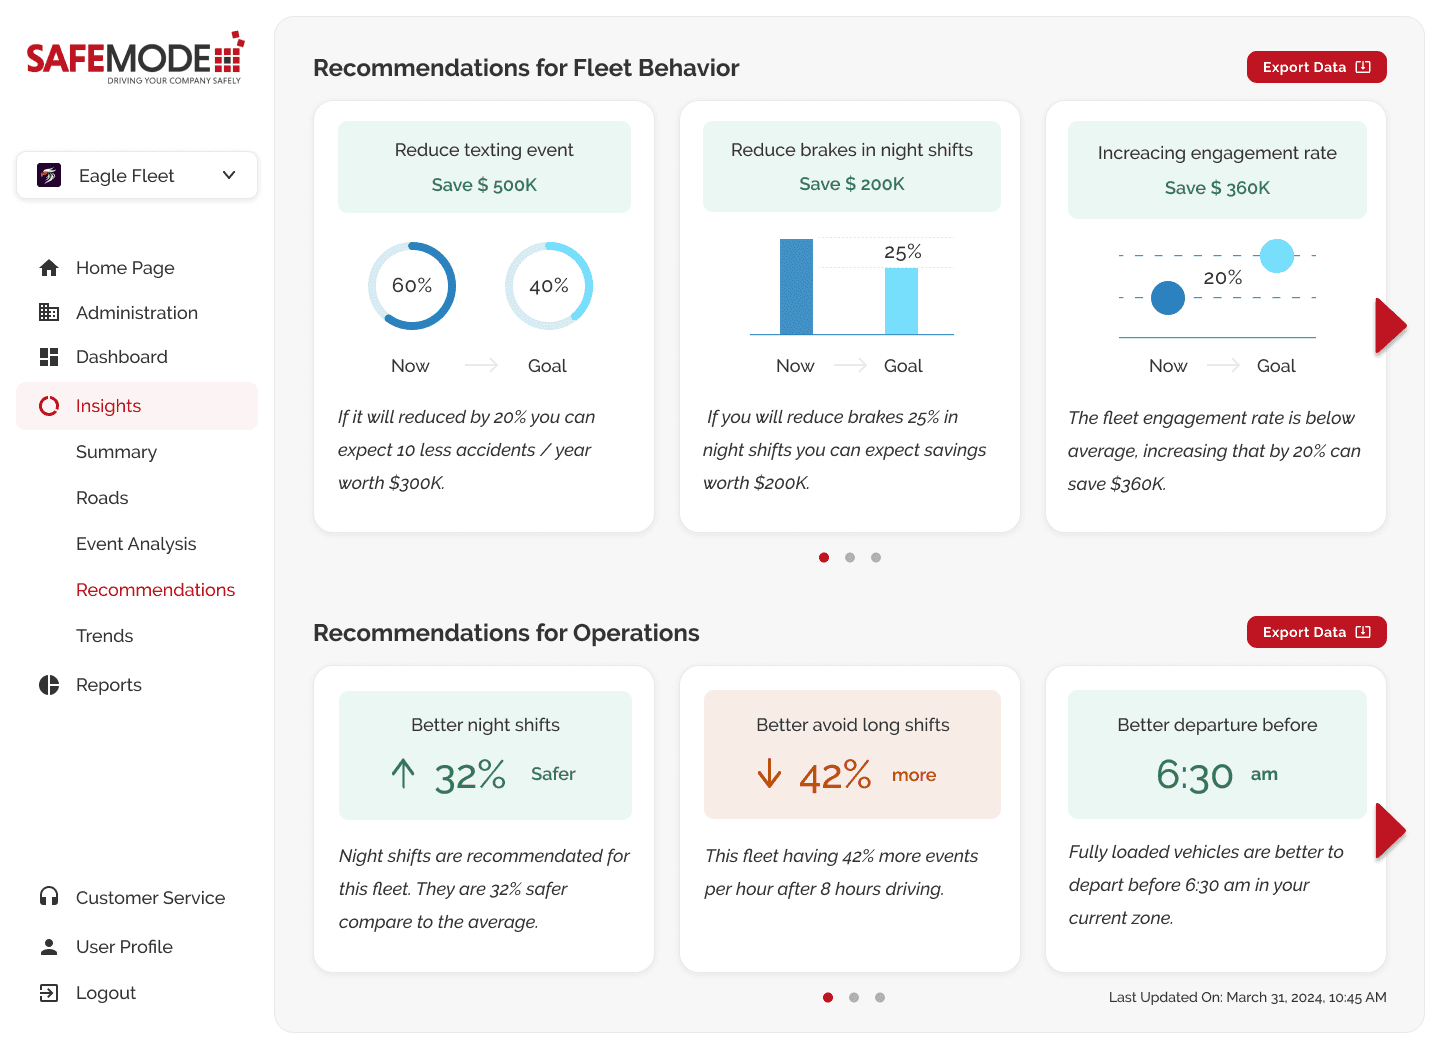
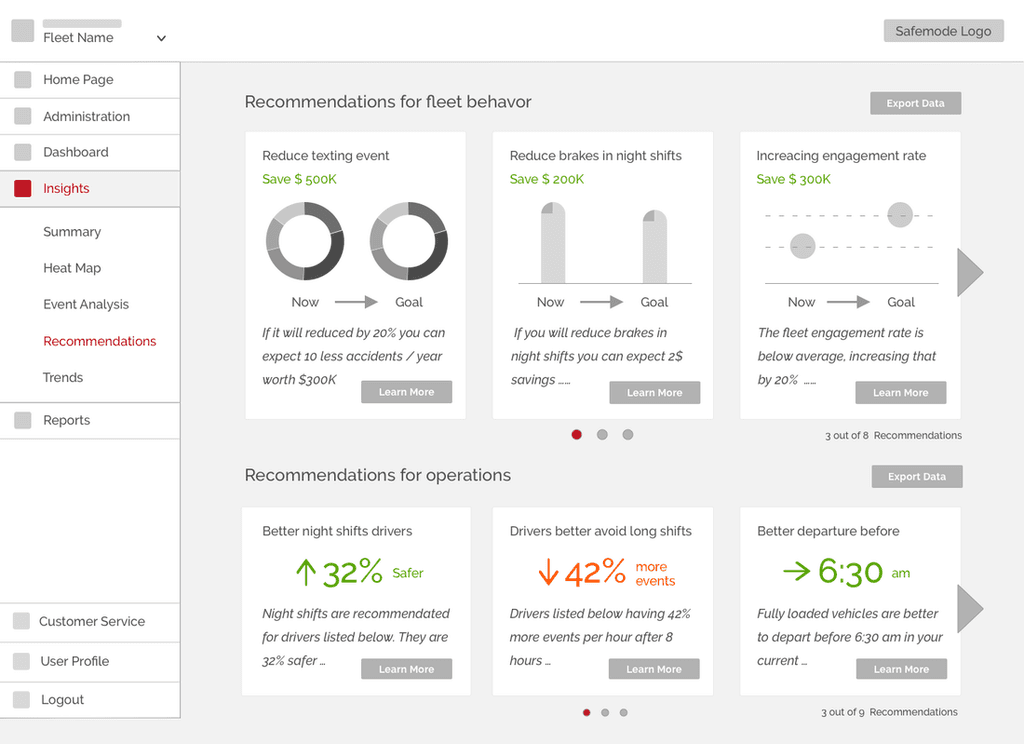
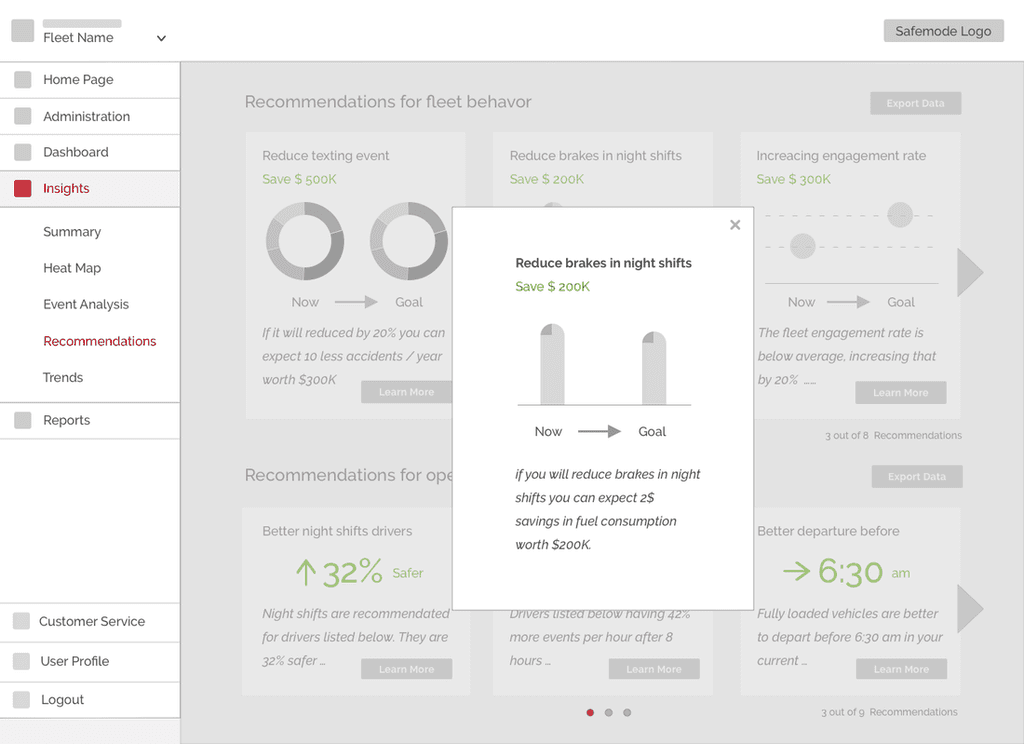
Recommendations Page
Offers actionable recommendations for fleet behaviors and operations.
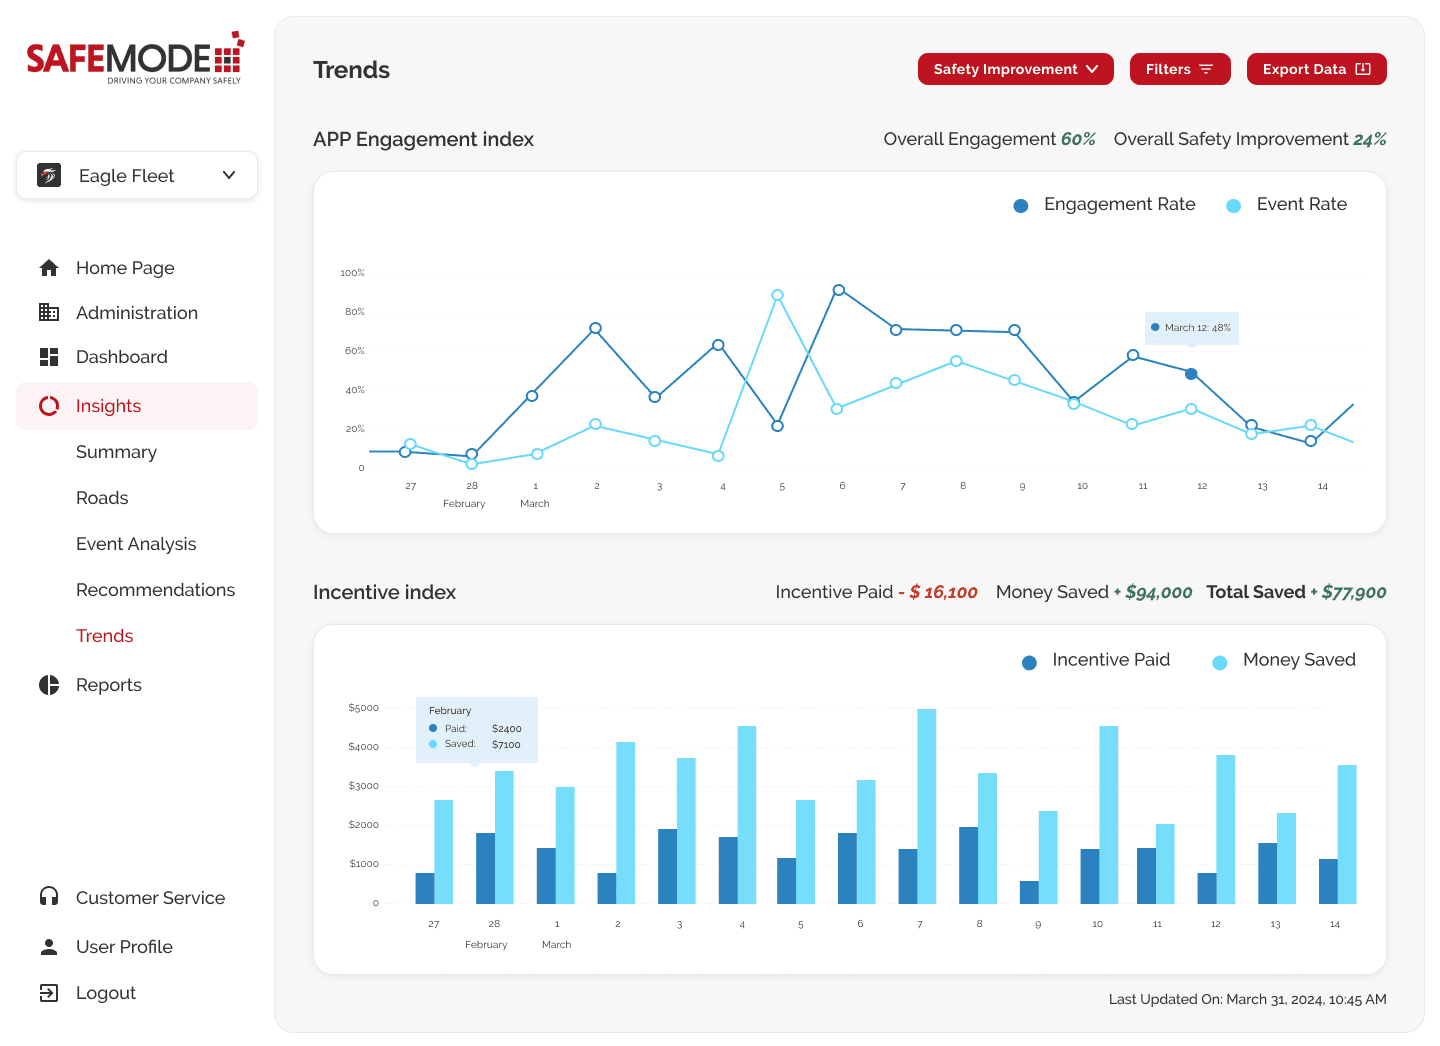
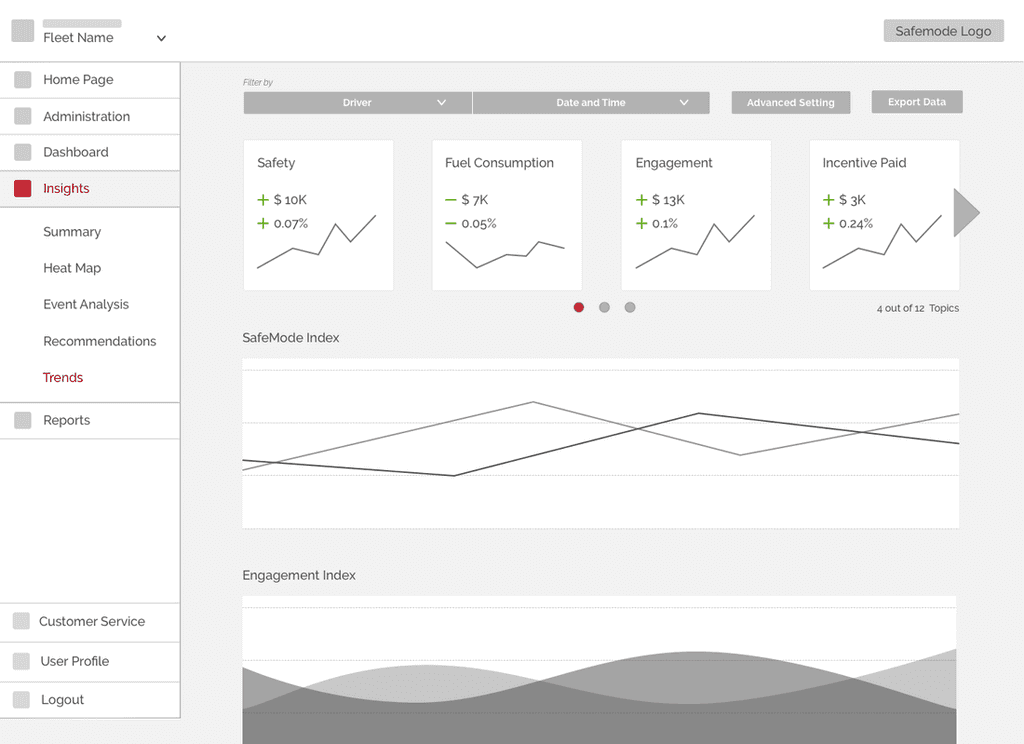
Trends Page
Provides fleet managers with insights into cost savings and safety improvements achieved through Safemode products.
The Process
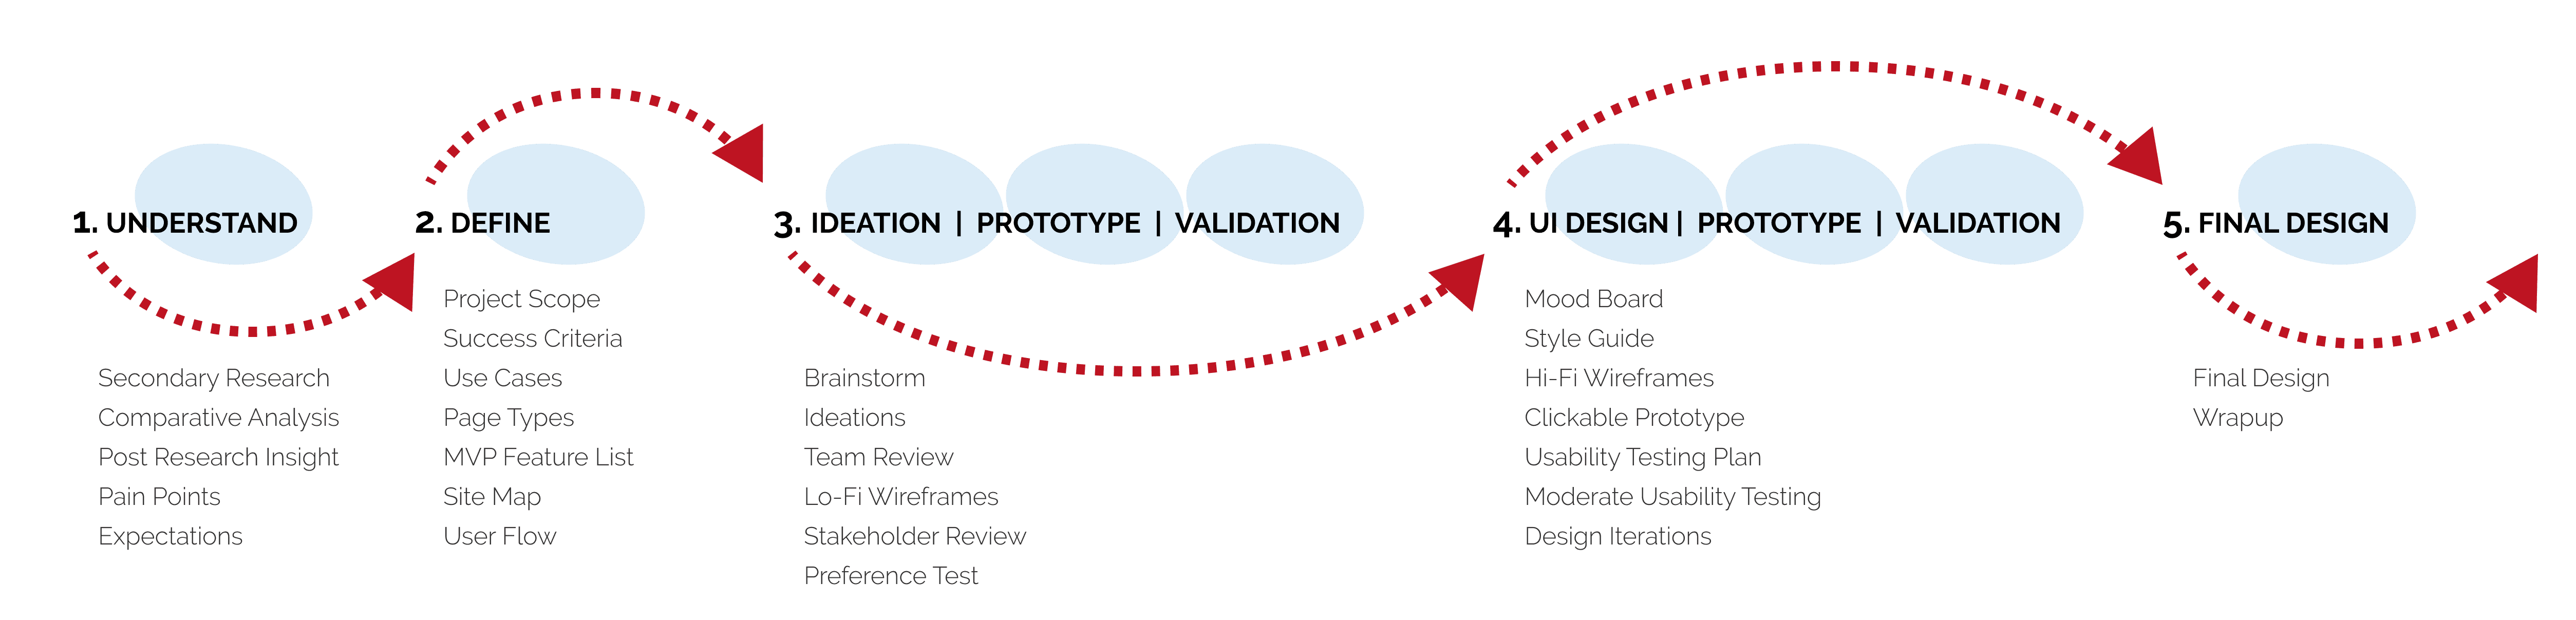
1. Understand
First, I conducted a brief round of secondary research and comparative analysis to gain industry familiarity.
Then, I reviewed the post research Insights to gather the key pain points.
Data presented to fleet managers often lacks actionable insights, hindering effective decision-making and improvement strategies.
Negative engagement with drivers leads to decreased motivation and cooperation.
Therefore, users prefer receiving insights and actionable tasks instead of exposing a vast amount of data every day. This includes:
Road condition and prediction
Critical events analysis
Recommendations
Trends prediction
2. Define
At this stage, we discussed the project scope, and established success criteria.
Next, I identified three primary use cases to be covered for this project.
Fleet managers utilize the insight feature to enhance their ability to identify and strategize drivers' work plans effectively.
Fleet managers leverage insights to gain deeper understanding of fleet behavior and create tailored incentive plans.
Fleet managers leverage insights to gauge safety improvements and associated cost savings.
Following that, we analyzed the types of pages needed for design and outlined the the Minimum Viable Product (MVP) feature lists. They are:
Summary page: Provides key insightsLocation page: Offers location-based fleet operation conditions and predictions
Event analysis page: Gathers insights on critical safety events
Recommendation page: Provides actionable suggestions for optimizing performance
Trend page: Tracks and measures efficacy improvements over time
Following this, I created a site map and user flow chart to visulize the structure.
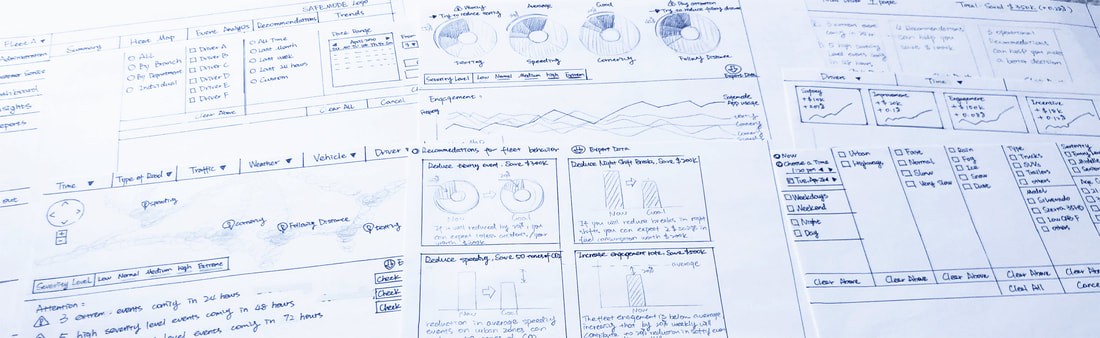
3. Ideation | Prototype | Presentation
During the brainstorming phase, I quickly conducted a research to Identify the Appropriate Diagram/Graph.
In this ideation phase, I sketched out initial ideas and shared them with the team, fostering discussions on potential solutions for addressing user pain points. This ensured alignment with the company's vision before diving into detailed design.
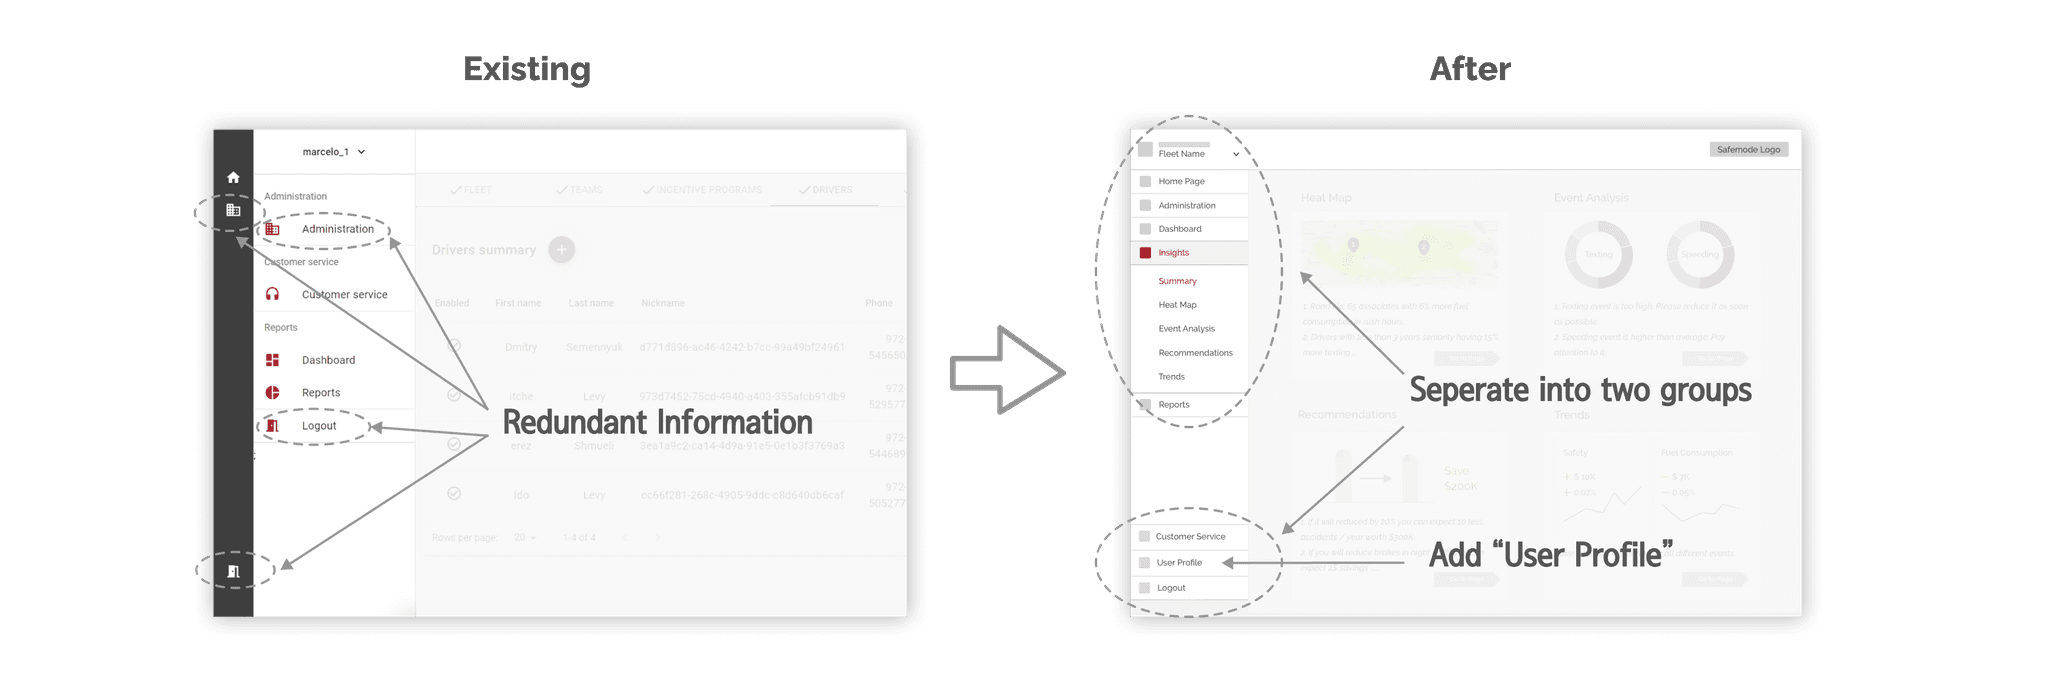
Team Review Key Findings:
Simplify the filter feature by relocating complex options to the advanced settings section.
Add more visual elements to attract users' attention for recommendations
After revising the design, I created low-fidelity wireframes for my proposed solutions. I then presented these wireframes to the team to address any technical concerns or limitations and to ensure that all features met their expectations.
Stakeholder Review Key Directions:
Offer a comprehensive overview of the most frequent events on the "Event Analysis" page to facilitate understanding.
Demonstrate the advantages of the company's mobile app using visual charts on the "Trends" page, highlighting its benefits
Due to potential data refresh issues, it would be beneficial to display the date and time of the last data update.
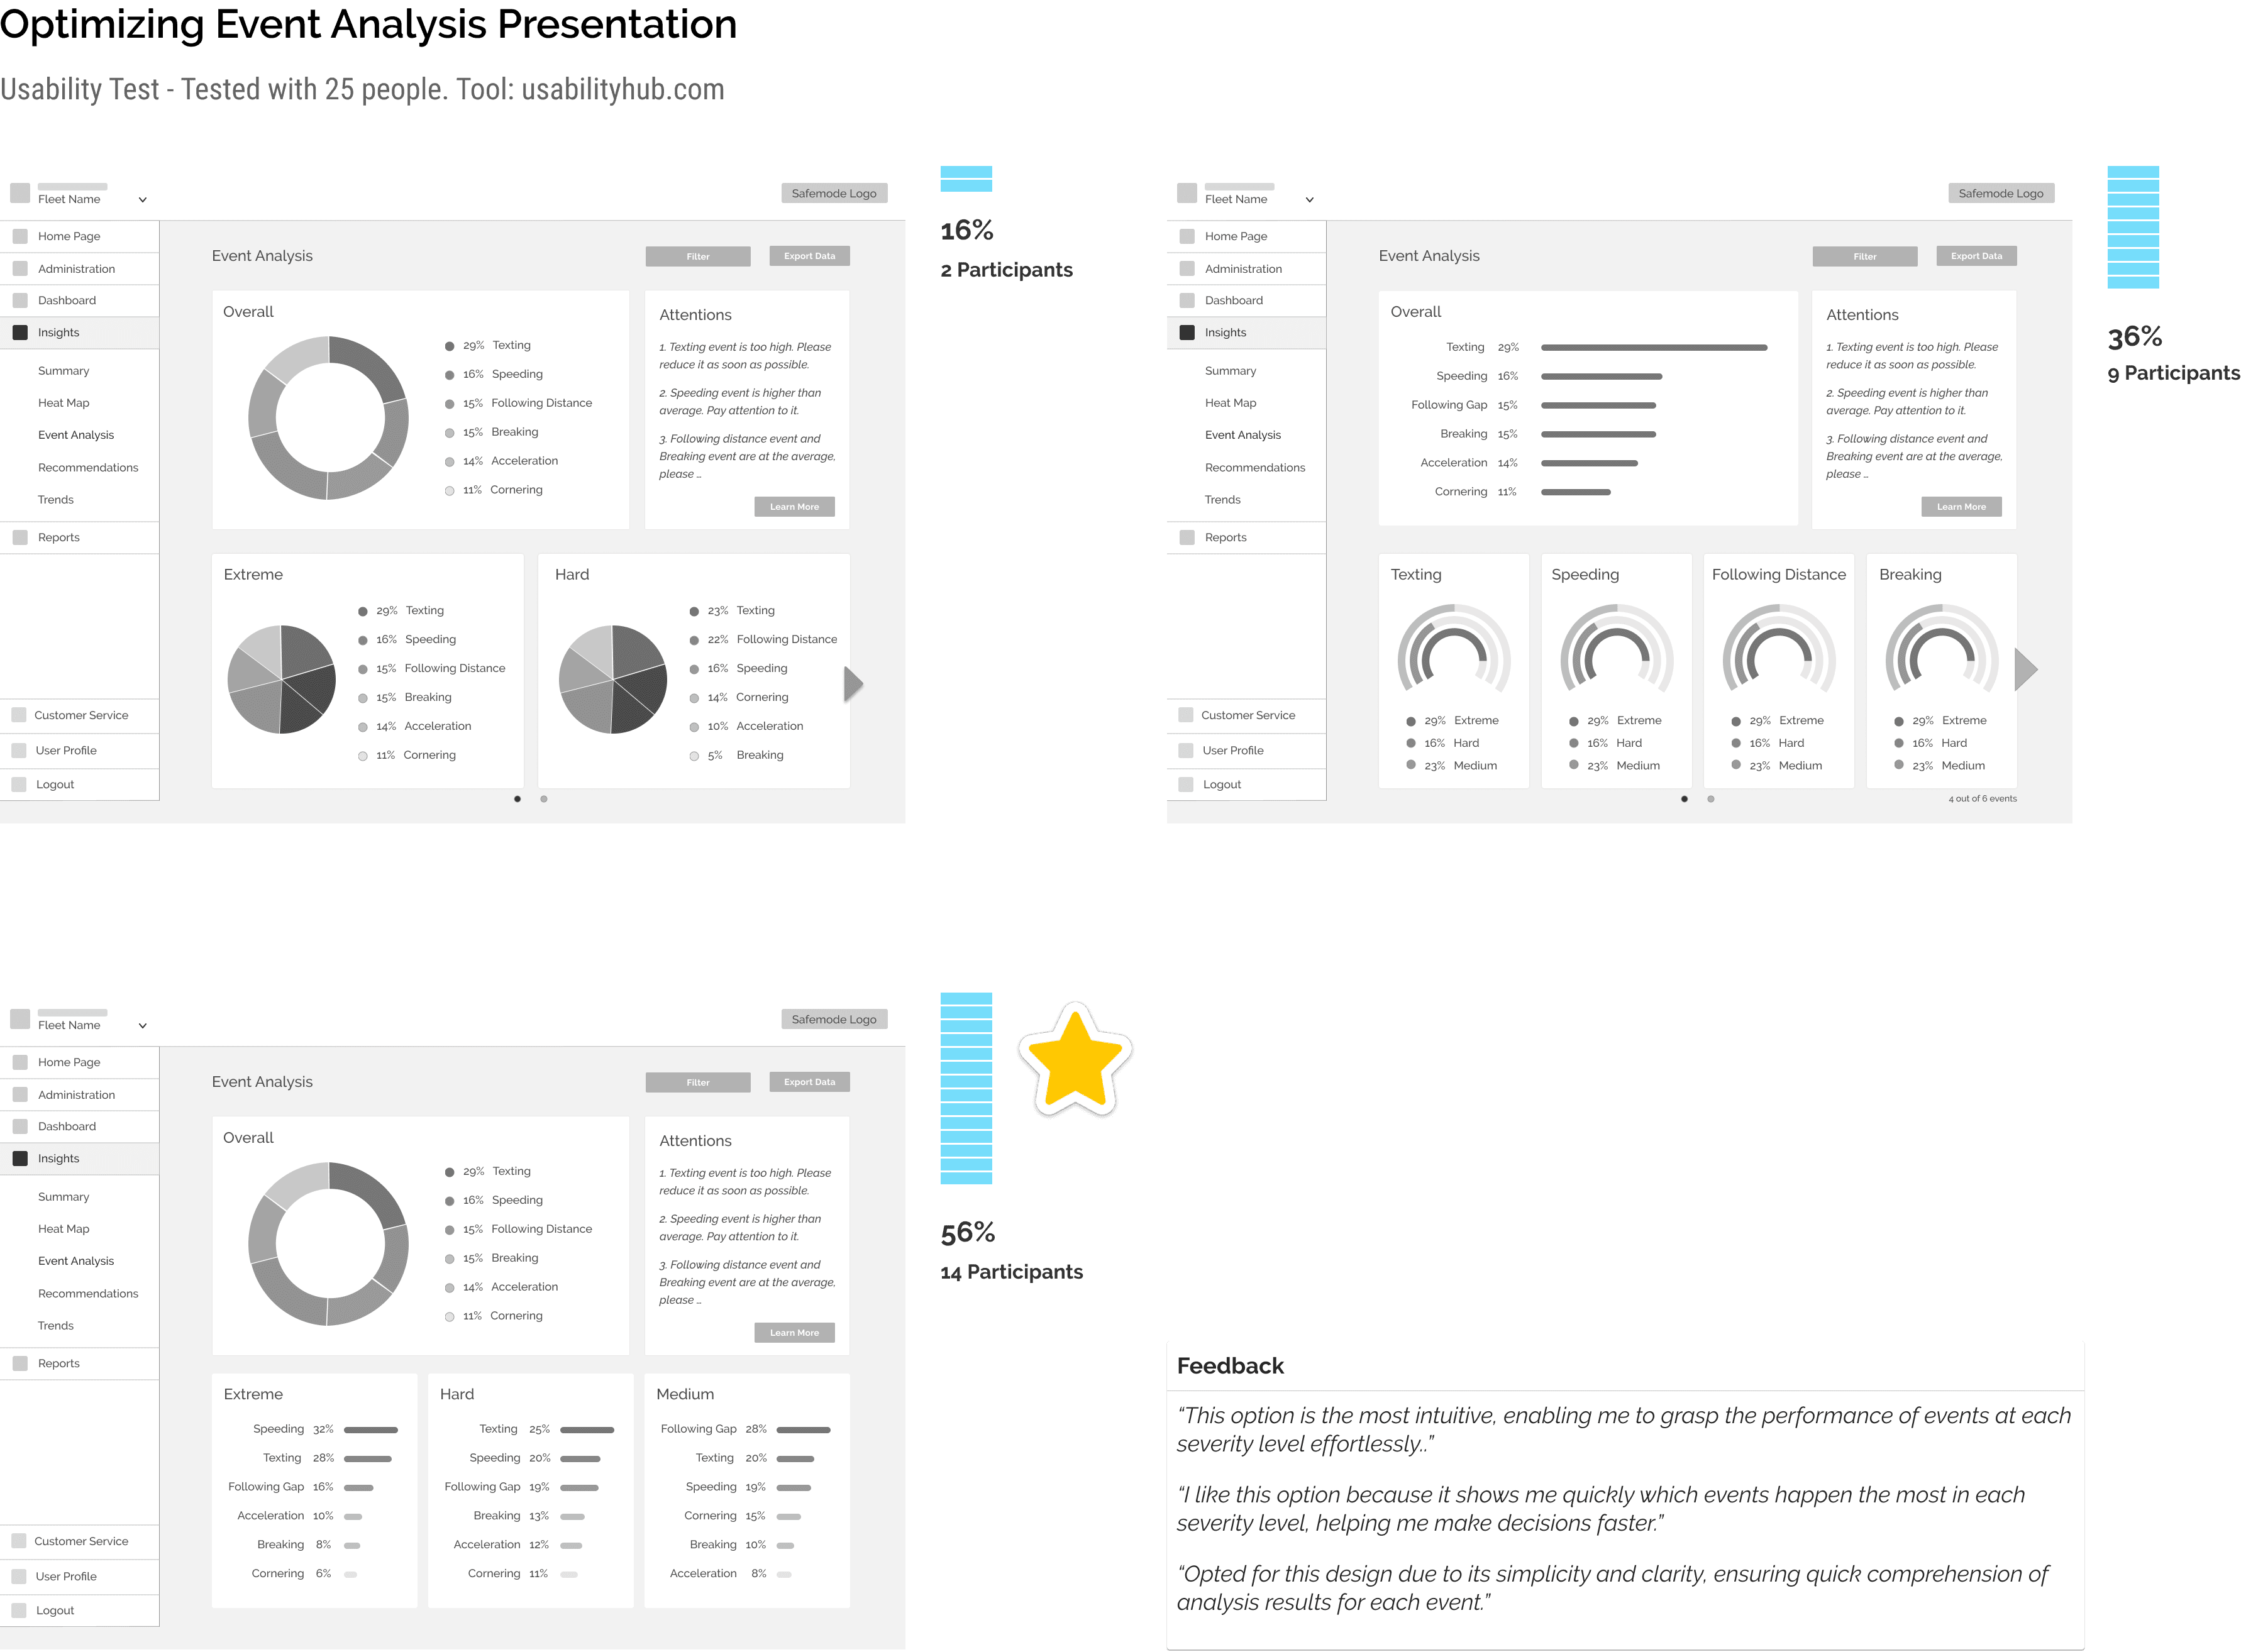
Following feedback, I iterated on the designs and conducted preference tests to determine the most intuitive way to present each set of data.
4. UI Design | Prototype | Validation
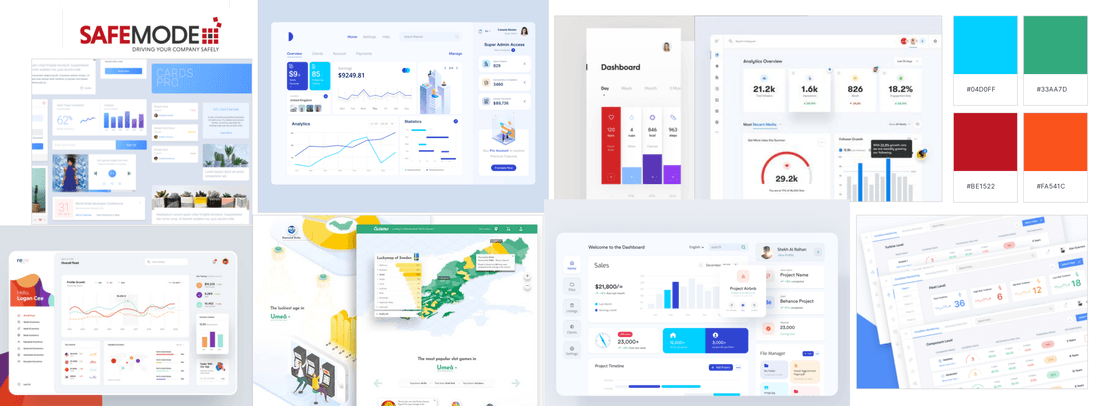
For this step, I began by creating a Mood Board to help me define my ideas and set the tone for the project.
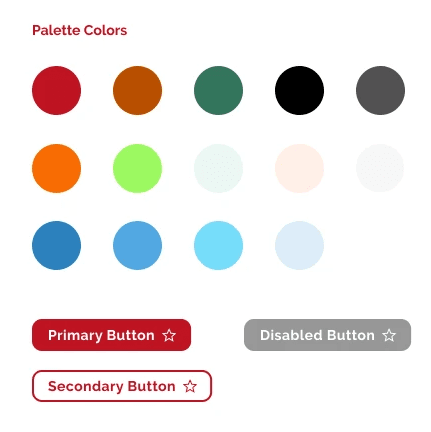
Then I created a color palette to maintain consistency in data visualization design, considering:
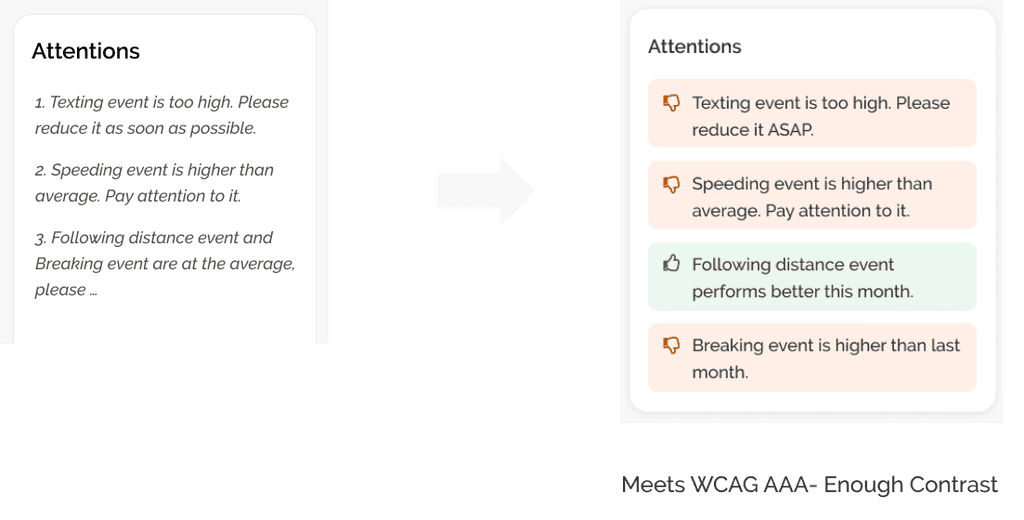
Readability and Accessibility: Compliant with WCAG guidelines, ensuring high contrast for readability.
Meaning and Representation: Red represents the logo color, avoid negative emotions
Avoid Overloading: Limiting the number of colors used to prevent visual clutter.
Color Palette Selection: Choosing a harmonious color palette that complements each other.
Consistency: Ensuring consistency across different visualizations for a cohesive look.
Emphasis and Highlighting: Using color to draw attention to important data points or insights.
Color Blind-Friendly: Avoiding reliance solely on color to convey information, ensuring accessibility for all users.
User Testing
At this stage, I applied the style guide to the user interface design of each screen and developed a clickable prototype using Invision. I also created a usability testing plan and conducted moderated usability testing. The objective was to test the app's design and ensure it is intuitive and easy to use.
Each round tested with 5 people, each person about 30-45 mins. Tool: Invision, Google hangout
Overall Findings:
The navigation was intuitive.
The information hierarchy was clear.
The features proved quite helpful.
Key feedback:
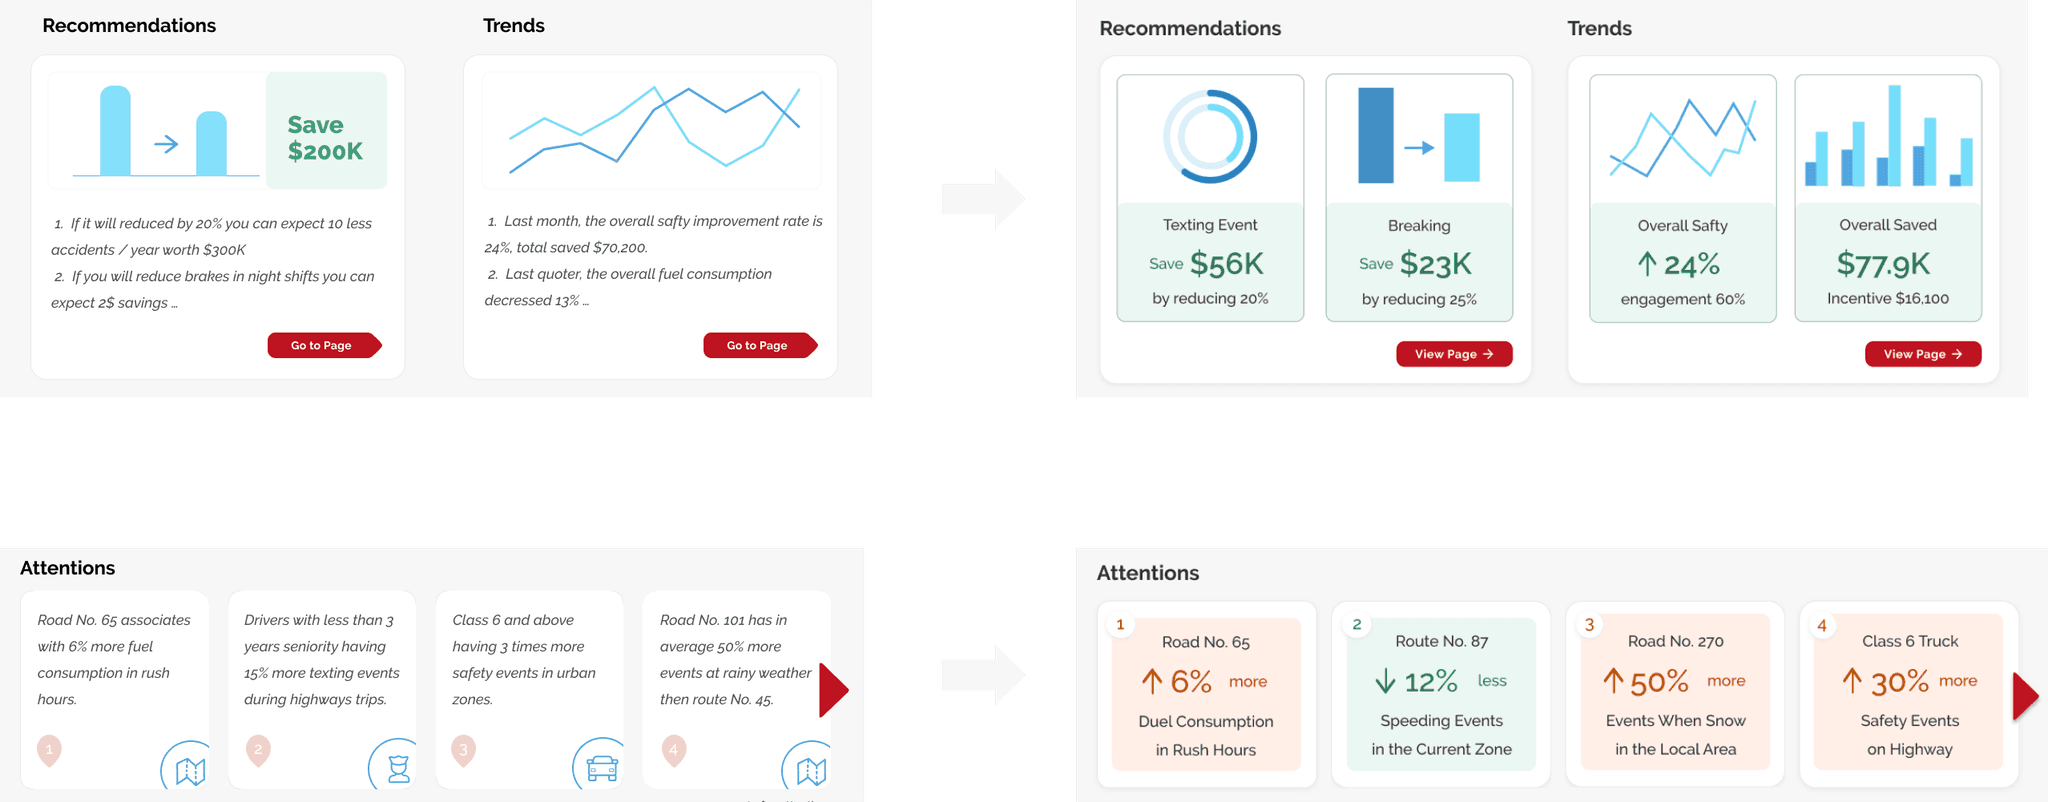
Users have expressed a preference for concise, visually appealing key information over lengthy, detailed content.
Users emphasized the necessity to swiftly differentiate between positive and negative analysis outcomes.
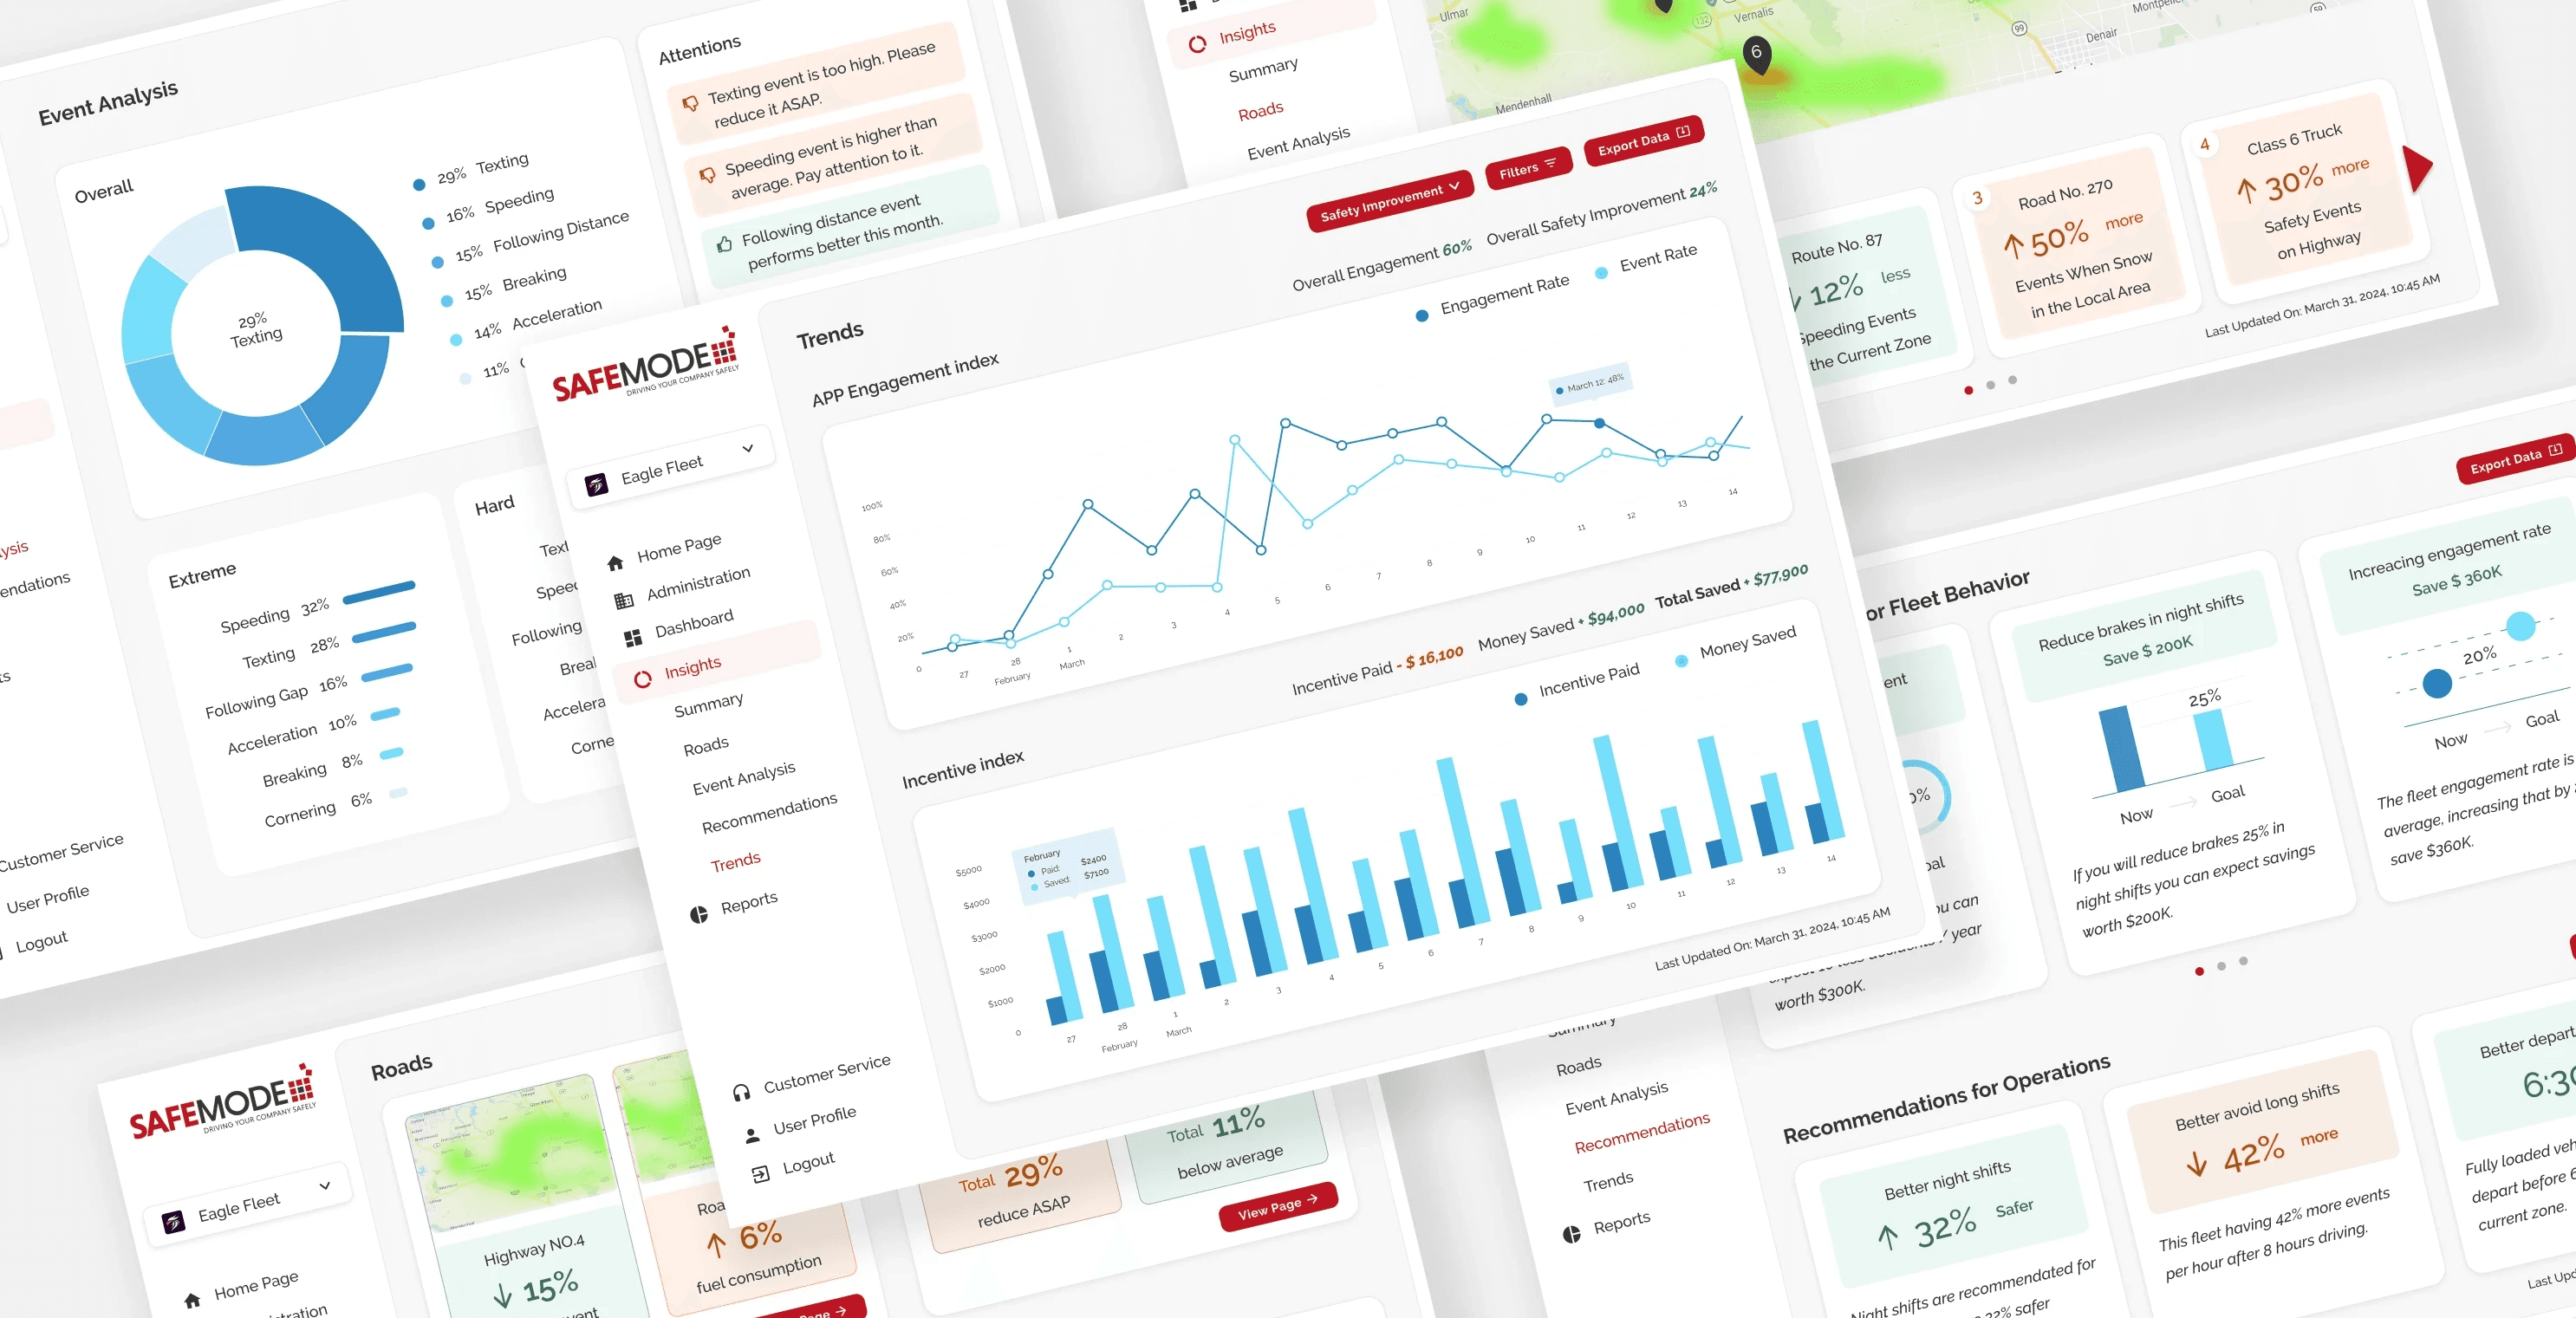
5. Hi-Fi Wireframes & Interactive Prototype
Below are HI-FI wireframes for key frame designs and the interactive prototype.
Add an insight feature to analyze drivers' behavior and road condition data, offering actionable recommendations to aid fleet managers in optimizing operations.
Data Insights Summary Page
Provides a quick snapshot of key data insights for efficient decision-making.
Roads Page
Offers fleet managers insights for planning based on current road conditions and predictions.
Event Analysis Page
Provides analysis on critical events and alerts users to potential safety issues.
Recommendations Page
Offers actionable recommendations for fleet behaviors and operations.
Trends Page
Provides fleet managers with insights into cost savings and safety improvements achieved through Safemode products.
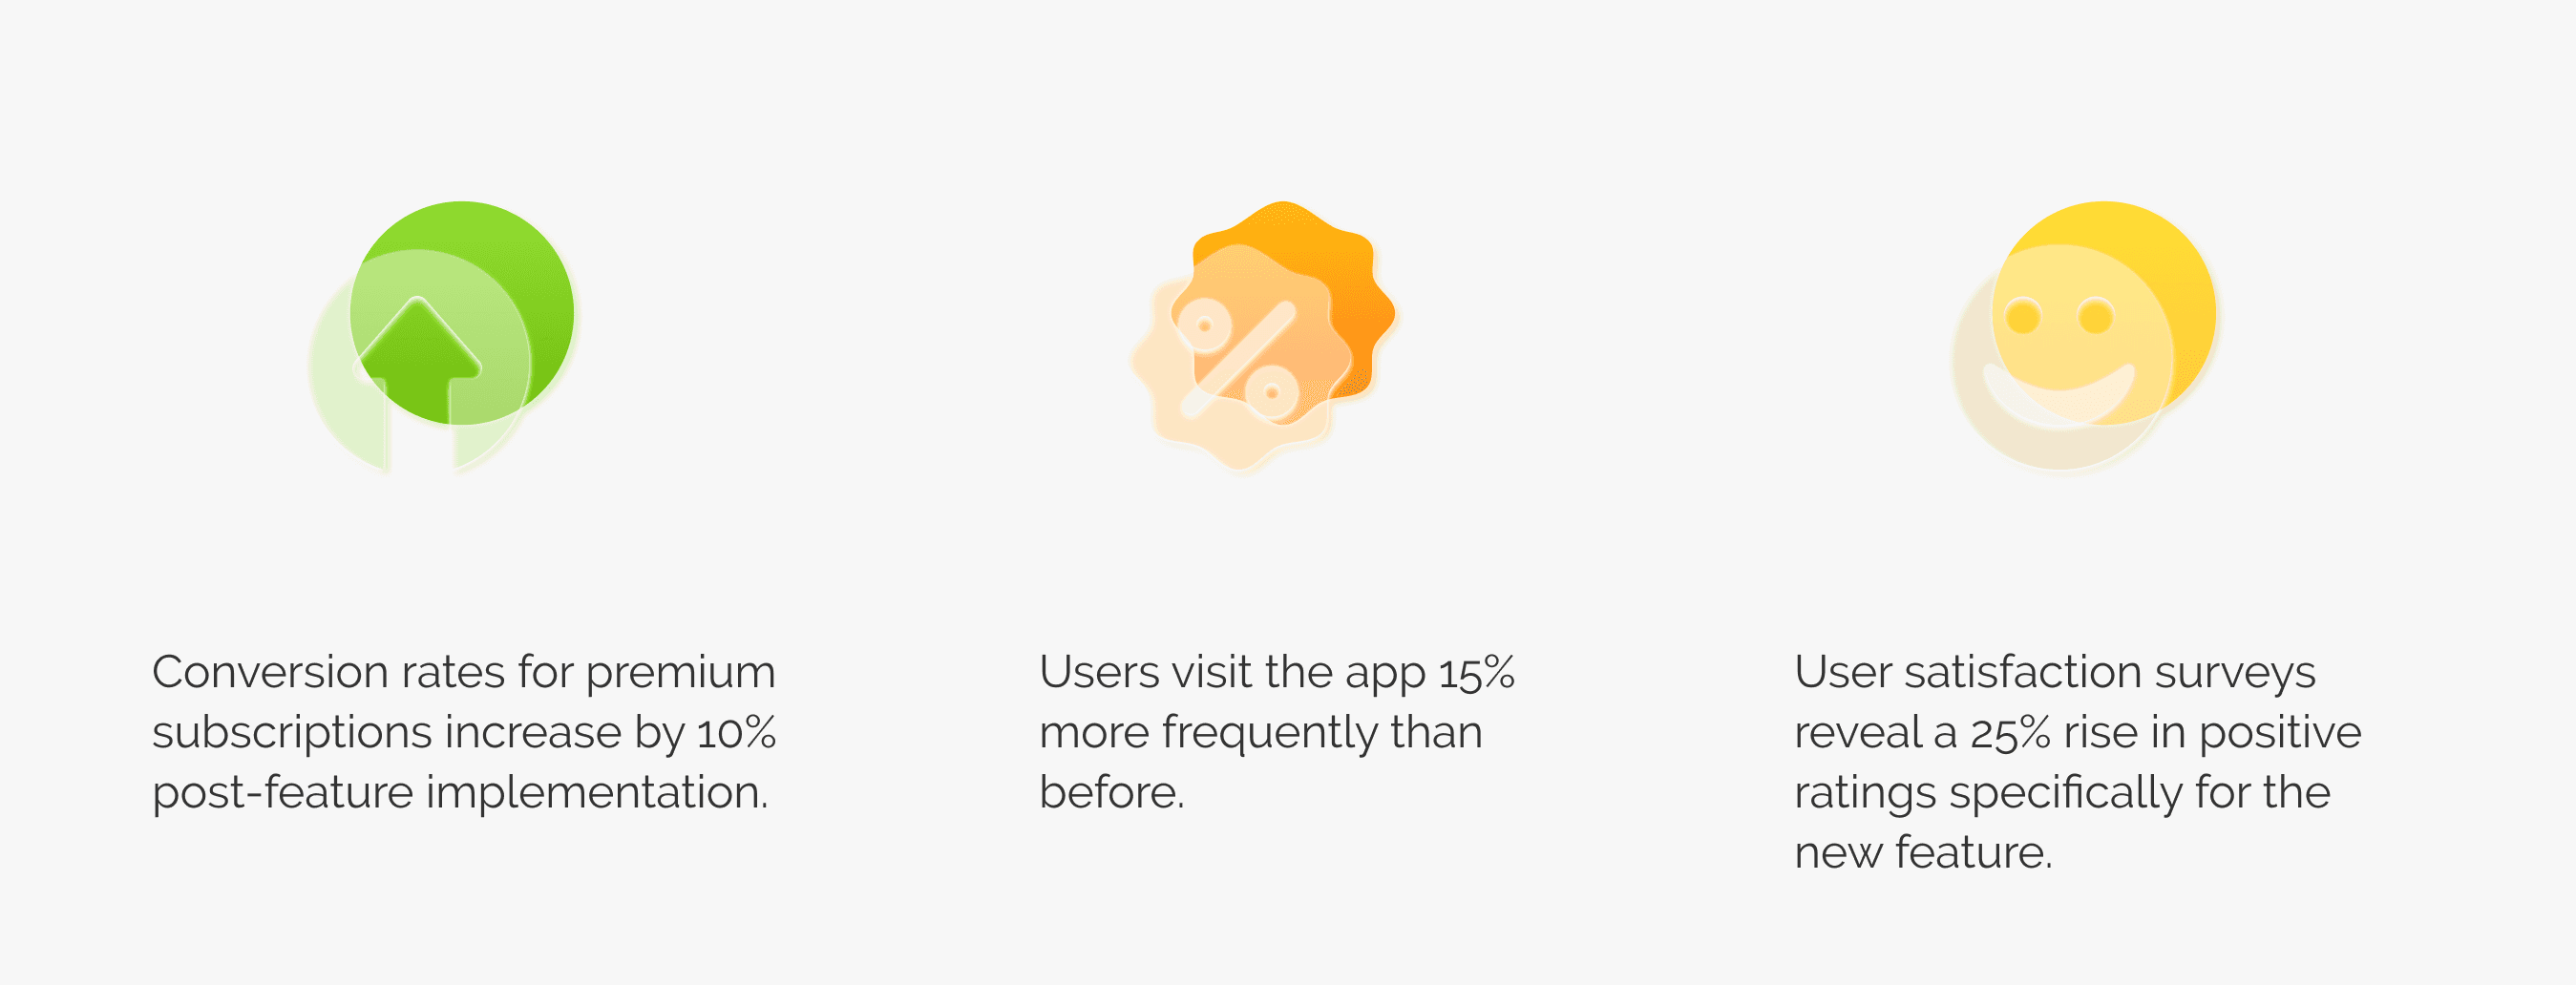
6. Measurements
The outcome we got was positive.
7. Thoughts
Surely, there is room for improvement as I primarily focused on the basic features during the implementation phase.
Below are my takeaways from this project:
In SaaS software, testing with the target group of users is crucial for obtaining insightful feedback.
Stakeholders' perspectives may shift with visualized solutions, highlighting the need for collaborative environments and quick synchronization.
If given the opportunity to redo this project with more time, I would make the following improvements:
Research: Conduct a round of surveys to validate the post-research results thoroughly.
Design & Iteration: Provide multiple solutions for each topic and think more creatively.
Implementation: I would like to be more involved and learn about any trade-offs that may arise during implementation.